Everything you need to go from purchase to chart — regardless of which indicator you're using.
Getting Access
Purchase or Trial
Visit smartswingtools.com to:
- Start a free trial of any indicator
- Purchase a monthly or yearly subscription
- Subscribe to the All-Access membership for the full toolkit
After purchase, you'll receive access within minutes. Check your email for confirmation and next steps.
TradingView Username
We need your TradingView username to grant indicator access. This is the username shown in your TradingView profile — not your display name and not your email address.
To find your username:
- Go to TradingView.com
- Click your profile icon (top right)
- Your username appears at the top of the dropdown
Provide this during checkout. If you missed it, email support@smartswingtools.com with your username and order confirmation.
<!-- IMAGE: tradingview-username.gif — TradingView profile dropdown with the username highlighted. --> Your TradingView username is shown in the profile dropdown.
Adding an Indicator to Your Chart
Once access is granted, the process is the same for all Smart Swing Tools indicators:
- Open TradingView and load any chart
- Click Indicators in the top toolbar (or press
/) - Select the Invite-Only tab
- Search for the indicator name (e.g., "Smart Swing Indicator PRO" or "Smart Turning Points")
- Click to add it to your chart
The indicator appears immediately with default settings.
<!-- IMAGE: invite-only-tab.png — TradingView Indicators panel with the Invite-Only tab selected and a Smart Swing Tools indicator visible in the list. -->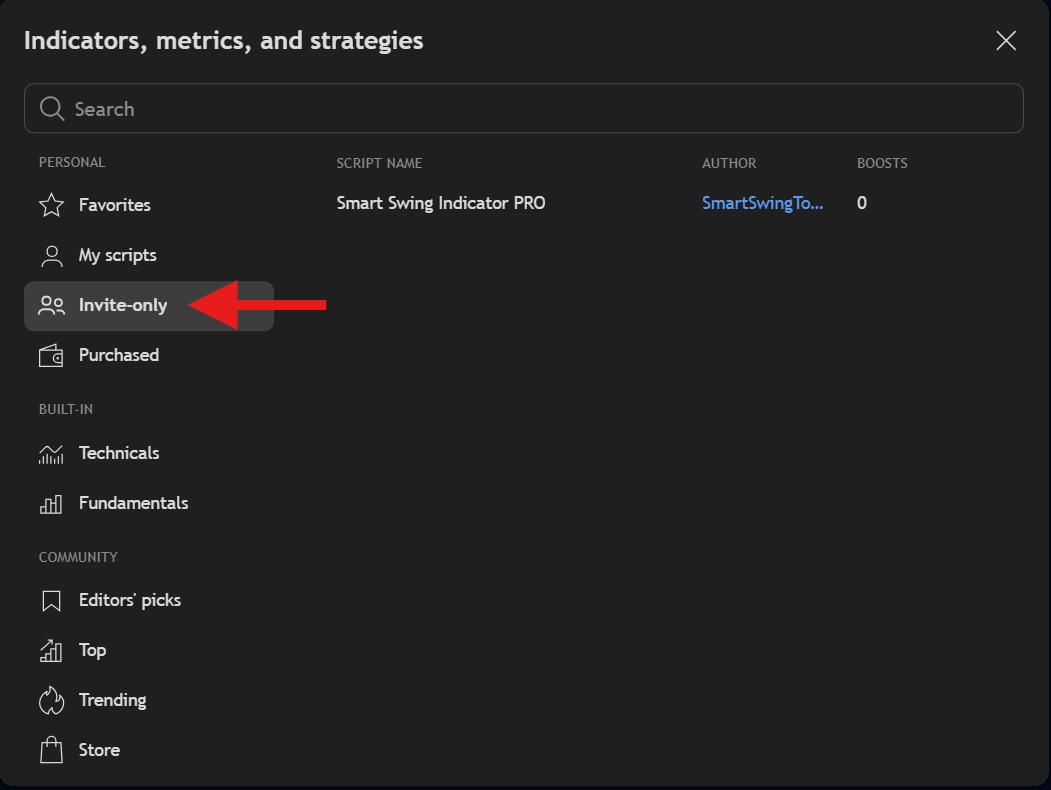 Smart Swing Tools indicators appear in your Invite-Only scripts after access is granted.
Don't See It?
If the indicator doesn't appear in Invite-Only:
- Wait a few minutes — TradingView can delay access propagation
- Refresh your browser — sometimes a simple reload resolves it
- Log out and back in to TradingView to force a session refresh
- Contact us at support@smartswingtools.com if it's been more than an hour
Managing Your Subscription
Your subscription is managed through your Smart Swing Tools dashboard at smartswingtools.com/dashboard. From there you can:
- View your active subscriptions and their status
- Update your TradingView username if it changes
- Access billing and payment details
- Cancel or modify your plan
Indicator access is tied to your TradingView username. If you change your TradingView username, update it in your dashboard so access stays uninterrupted.
How Invite-Only Access Works
TradingView's invite-only system means you won't find Smart Swing Tools indicators through normal search — they only appear in the Invite-Only tab after we've granted your username access.
This is how all professional TradingView indicators work. It's not a limitation — it's how TradingView protects paid content. Once granted, access remains active for the duration of your subscription.
What you can do with access:
- Add the indicator to any chart, any instrument, any timeframe
- Use it on multiple charts simultaneously
- Access it from any device where you're logged into TradingView
What you cannot do:
- Share the indicator with other TradingView users
- Export or copy the indicator's source code
Choosing an Indicator
Not sure which indicator to start with? Here's the short version:
Smart Swing Indicator PRO (SSI PRO) — Single-timeframe depth. Detailed swing analysis on one timeframe with line drawing, pattern detection, metrics, alerts, and CSV export. Best if you work primarily on one timeframe and want maximum analytical detail.
Smart Turning Points (STP) — Multi-timeframe breadth. Simultaneous swing detection across 10 timeframes with hierarchical counting, X-Ray structural overlay, and 63-column CSV export. Best if you need to see how different timeframes interact and nest within each other.
All-Access Membership — Both indicators (and future releases) under one subscription. The natural choice if you want the complete toolkit.
Each indicator has its own Quick Start guide to get you from zero to chart in under 3 minutes:
Getting Help
Email: support@smartswingtools.com
Response time: Usually within 24 hours.
When reporting an issue, include:
- Your TradingView username
- Which indicator and which setting configuration
- A screenshot showing the problem
- The instrument and chart timeframe you're using
Next Steps
- SSI PRO Quick Start — Get SSI PRO on your chart in under 3 minutes
- STP Quick Start — Get STP on your chart in under 3 minutes
- SSI PRO Overview — The philosophy behind single-timeframe swing analysis
- STP Overview — The philosophy behind multi-timeframe swing detection
- Troubleshooting — Common issues and solutions
- FAQ — Frequently asked questions