Real-Time Swing Notifications
Charts are useful when you're watching them. Alerts are useful when you're not.
SSI PRO can notify you when specific swing conditions occur — new swings completing, metrics exceeding thresholds, price approaching significant levels. You define the conditions; the indicator watches for them continuously.
Alert Types
SSI PRO offers several alert categories:
| Alert Type | Triggers When |
|---|---|
| Swing Completion | A new swing high or low is confirmed |
| Overbalance (Pr, Px, Tr, Tx, Vr, Vx) | A metric exceeds your threshold |
| Velocity Overbalance (Vel-x, Vel-r) | Velocity metric exceeds your threshold |
| Outside Bar | An outside bar is detected |
| S/R Proximity | Price approaches a prior swing extreme |
Each alert type can be enabled independently with its own configuration.
Alert Modes: Human-Readable vs JSON Webhook
SSI PRO supports two mutually exclusive alert modes:
Human-Readable Alerts (Default)
- Individual alerts fire with descriptive messages
- Messages include dynamic values (e.g., "AAPL Px Overbalance: 156.2%")
- Best for: Email notifications, mobile push, manual monitoring
JSON Webhook Mode
- Enable "Enable JSON Webhook" in Settings → Alerts
- All human-readable alerts are automatically disabled
- Only structured JSON payloads are sent on swing completion
- Best for: Database integration, automated systems
Important: You cannot receive both webhook JSON and human-readable alerts simultaneously from the same indicator instance. If you need both, add the indicator to your chart twice with different settings — one for human alerts, one for webhook.
Tip: For the alerts-only instance, disable visual elements to keep your chart clean:
- Set "Show Swing Lines" to OFF
- Set "Show Range Labels" to OFF
- The indicator runs invisibly as a dedicated alert engine
Swing Completion Alert
The most fundamental alert: notification when a swing point is confirmed.
What Triggers It
A swing completion alert fires when:
- A new swing HIGH is confirmed (upswing ended, downswing beginning)
- A new swing LOW is confirmed (downswing ended, upswing beginning)
The alert fires at confirmation, not at the extreme. This means the swing point is final — it won't be redrawn or invalidated.
Alert Information
The alert message includes:
- Symbol with chart timeframe (e.g., "ES (D)", "SI (240)")
- Swing direction (High or Low)
- Price at the extreme
- Swing start date
Example message:
ES (D) Swing High completed at 4525.75
Swing Start: Jan 6, 2025
The swing start date tells you when the move began, helping you quickly contextualize the duration and significance of the completed swing.
Use Cases
- Track swing structure across multiple instruments
- Log swing completions to external systems
- Trigger manual review when structure changes
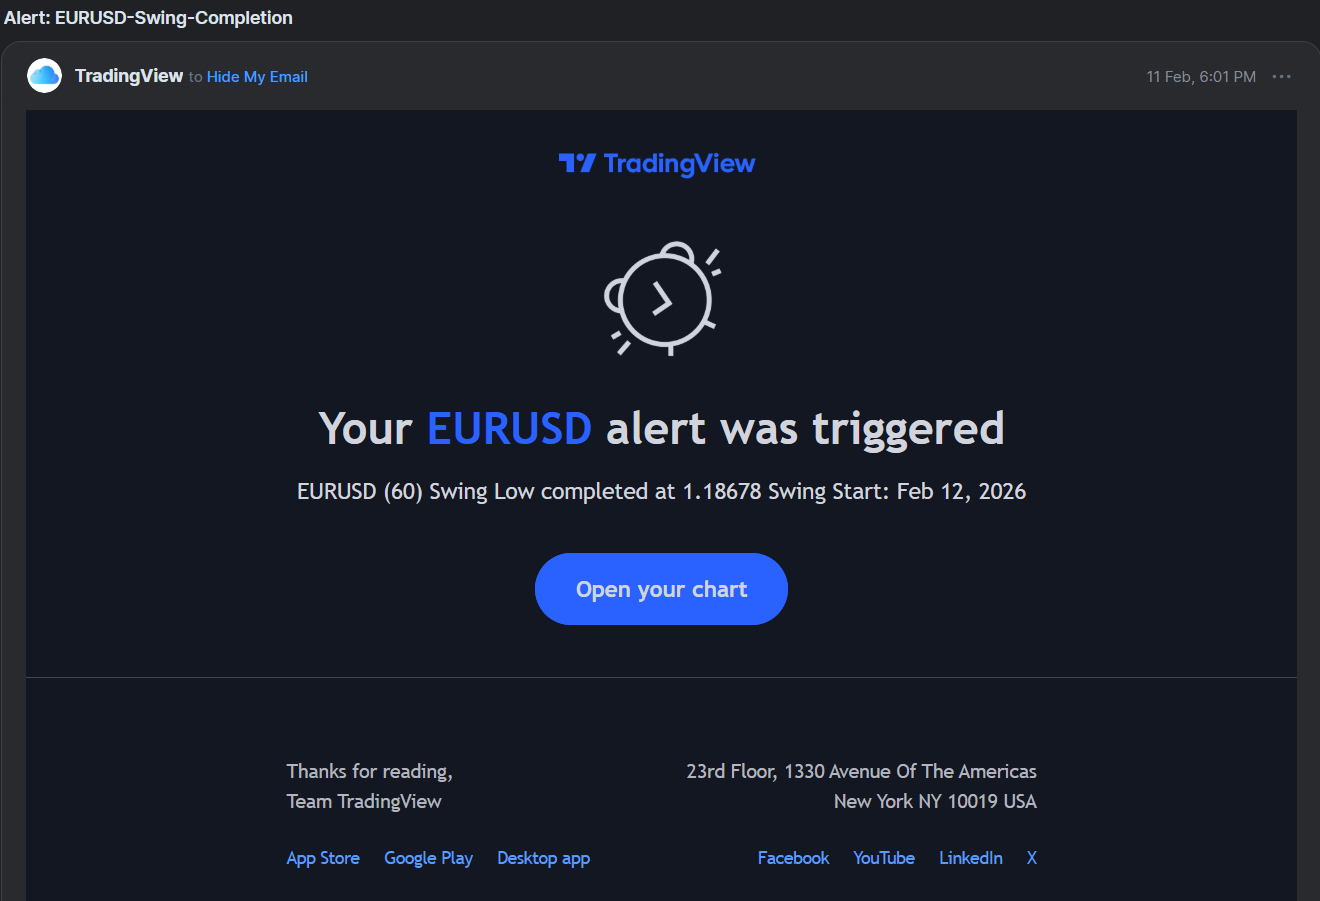 Swing completion alerts fire when a new high or low is confirmed.
Overbalance Alerts
Overbalance alerts notify you when swing metrics exceed specified thresholds.
Available Metrics
You can set threshold alerts for any of the six ratio metrics:
| Metric | What It Measures |
|---|---|
| Pr | Price Retracement % (vs previous opposite swing) |
| Px | Price Extension % (vs previous same-direction swing) |
| Tr | Time Retracement % |
| Tx | Time Extension % |
| Vr | Volume Retracement % |
| Vx | Volume Extension % |
How Thresholds Work
Each metric has a configurable threshold (default: 100%).
When a completed swing's metric exceeds the threshold, the alert fires.
Example: Px Threshold at 100%
- Previous up swing: 50 points
- Current up swing: 60 points
- Px = 120% (exceeds 100%)
- Alert fires
Example messages:
Price Extension (Px):
AAPL (D) Px Overbalance: 120.0% [thr:100%]
UP swing: 12.50 pts (prev: 10.42 pts)
Swing Start: Jan 15, 2025
Time Extension (Tx):
ES (W) Tx Overbalance: 100.0% [thr:100%]
UP swing: 5.0 days (prev: 5.0 days)
Swing Start: Dec 23, 2024
Each overbalance alert now includes:
- Swing direction (UP or DOWN) — Immediately know which way the market moved
- Current vs previous values — See the actual comparison (points for Px/Pr, days for Tx/Tr)
- Swing start date — Know when the move began
This context helps you assess the alert without opening the chart. A Px of 120% hitting after a 3-day swing tells a different story than the same percentage after a 3-week swing.
Overbalance Significance
"Overbalance" is a term from classical swing analysis. When a swing exceeds 100% of a reference swing, it has "overbalanced" — moved further than the prior comparable move.
Overbalance in price, time, or both can signal:
- Trend acceleration (Px > 100% in trend direction)
- Potential exhaustion (Pr > 100% against trend)
- Character change in market behavior
Configuration
For each metric you want to track:
- Enable the specific overbalance alert
- Set your threshold percentage
- Alert fires when any swing exceeds that threshold
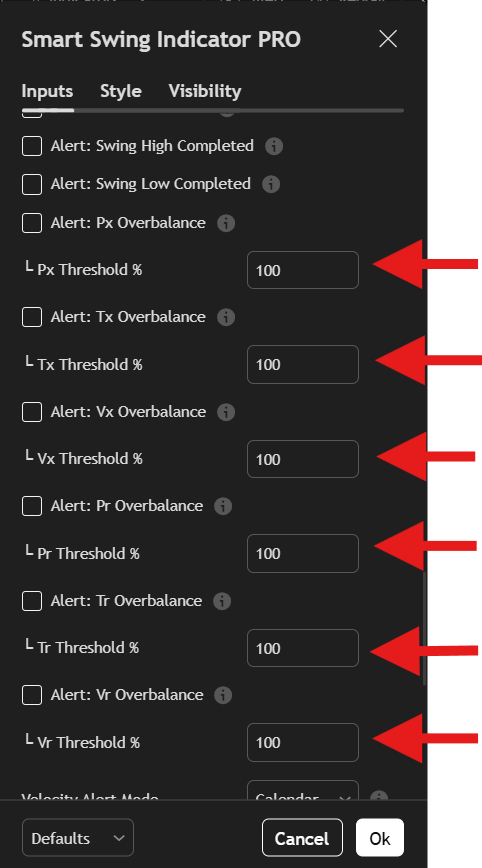 Set thresholds for each metric you want to monitor.
Velocity Overbalance Alerts
Notifies you when swing velocity exceeds specified thresholds.
What Is Velocity?
Velocity measures how fast price moved — range divided by time. A swing that covers 50 points in 2 days has higher velocity than one covering 50 points in 10 days.
SSI PRO offers two velocity calculations:
| Mode | Calculation | Best For |
|---|---|---|
| Calendar | Range ÷ calendar days (includes weekends/gaps) | Real-world time analysis |
| Trading Bars | Range ÷ bar count | Chart-based analysis |
Velocity Alert Mode
Setting: Velocity Alert Mode
Options: Calendar, Trading Bars, Both
Default: Calendar
This dropdown controls which velocity calculation triggers your alerts:
- Calendar: Alerts based on calendar velocity only
- Trading Bars: Alerts based on bar velocity only
- Both: Alerts when either condition is met
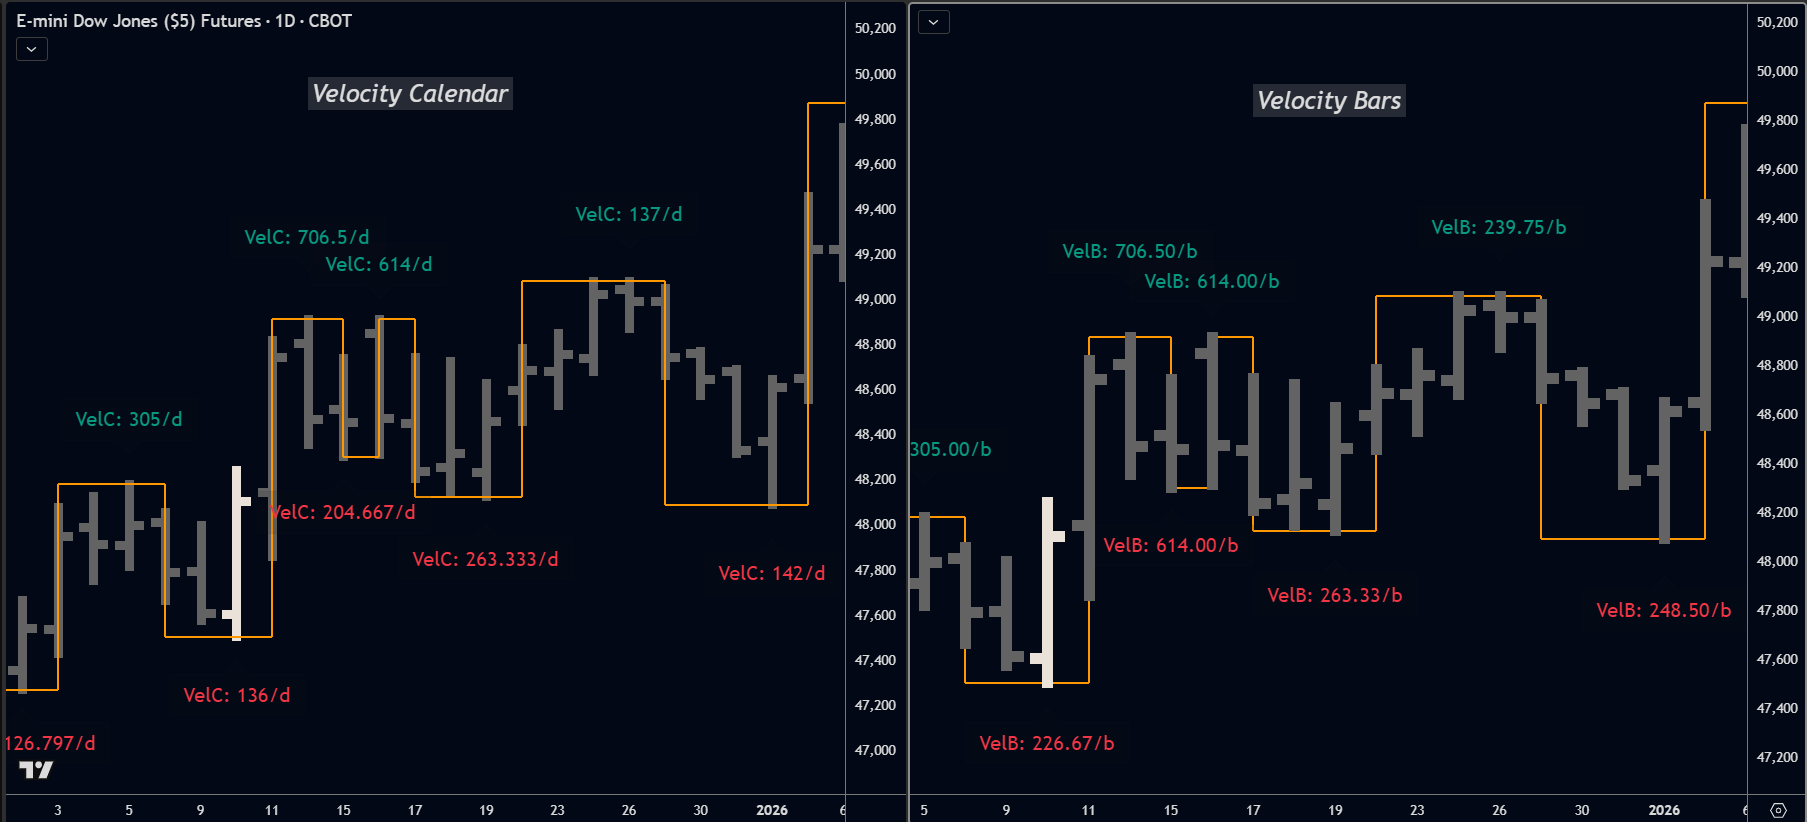 Calendar velocity includes weekends and gaps; bar velocity counts only trading sessions.
Available Velocity Alerts
Vel-x (Velocity Extension)
Compares current swing's velocity to the previous same-direction swing.
Vel-r (Velocity Retracement)
Compares current swing's velocity to the previous swing (any direction).
Example Message
ES (D) Vel-x Overbalance (Calendar): 145.2% [thr:100%]
UP swing velocity vs previous same-direction
Swing Start: Jan 15, 2025
The message indicates which velocity mode triggered the alert (Calendar or Bars), helping you understand the context without opening the chart.
Use Cases
- Detect acceleration in trend moves (Vel-x > 100%)
- Identify aggressive counter-moves (Vel-r > 100%)
- Monitor for velocity exhaustion (declining Vel-x over successive swings)
Outside Bar Alert
Notifies you when an outside bar is detected.
What Triggers It
The alert fires when a bar exceeds the previous bar's range on both sides (higher high AND lower low).
This alert fires at detection, before resolution. You're being notified that an outside bar has occurred — the next bar will determine how it resolves.
Example message:
SI (240) Outside Bar detected
Outside bar alerts remain simple notifications — the key information is that volatility expansion has occurred. Open the chart to see how it resolves.
Use Cases
- Monitor for volatility expansion
- Track potential reversal setups
- Log outside bar frequency for analysis
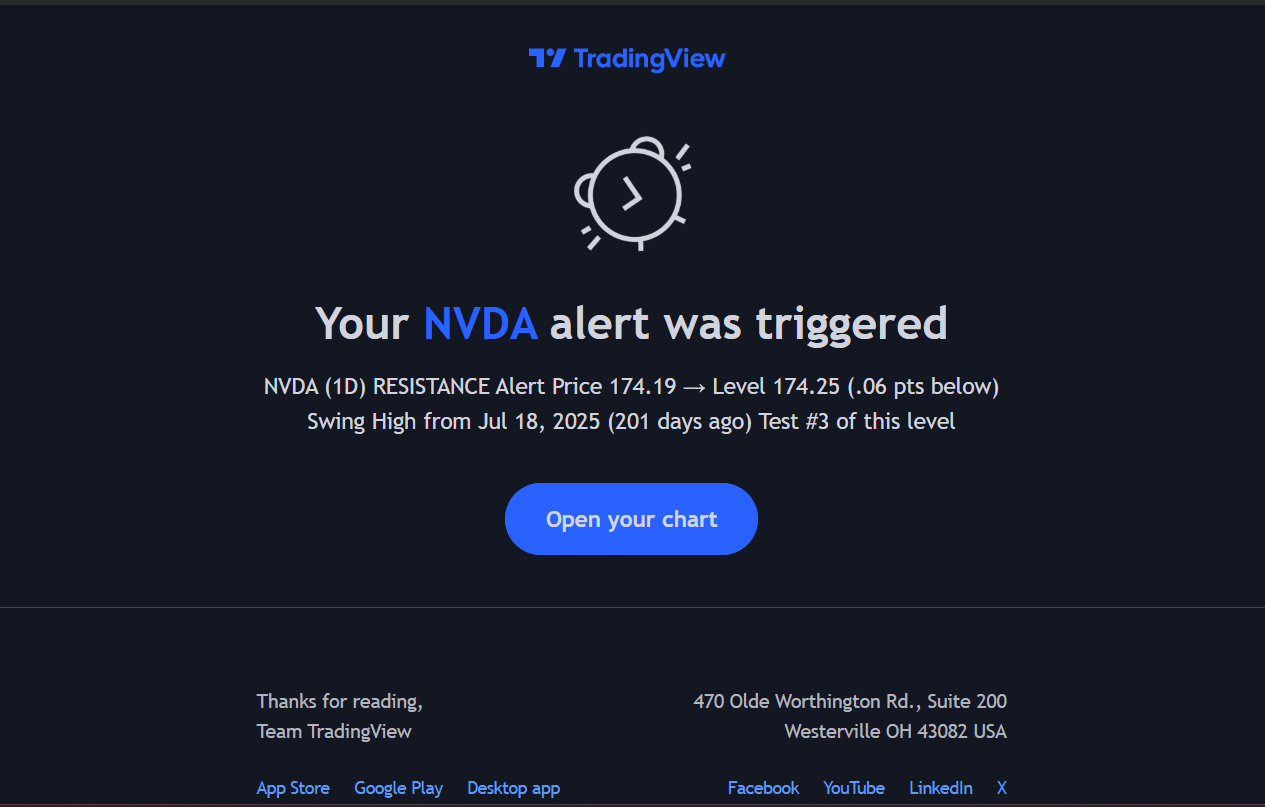
S/R Proximity Alert
Notifies you when price approaches a previous swing extreme.
The Concept
Every swing high is potential resistance. Every swing low is potential support. When price returns to these levels, the market is "testing" prior structure.
S/R Proximity alerts watch for these tests automatically.
Configuration Options
Minimum Age How old must a swing be to qualify?
- Setting: Number of swings
- Example: "5" means only alert on swings at least 5 swings ago
- Purpose: Filters out recent, less-established levels
Tolerance How close must price be to trigger the alert?
- Setting: Points or percentage
- Example: "10 points" or "0.5%"
- Purpose: Defines the "proximity zone" around each level
Type Which levels to monitor?
- Options: Support Only, Resistance Only, Both
- Purpose: Focus on levels relevant to your analysis
Max History How far back to look?
- Setting: Number of swings (50-500)
- Purpose: Limits alerts to more relevant historical levels
How It Works
The indicator maintains a list of prior swing extremes. On each bar, it checks:
- Is current price within tolerance of any tracked level?
- Is that level old enough (meets minimum age)?
- Is it the right type (support/resistance)?
If all conditions are met, the alert fires.
Example message:
AAPL (W) RESISTANCE Alert
Price 185.50 → Level 187.80 (2.30 pts below)
Swing High from Oct 15, 2024 (103 days ago)
Test #3 of this level
Each S/R proximity alert now includes:
- Historical date — When the original swing formed
- Days ago — How old the level is in calendar time
- Swing type — Whether it was a Swing High (resistance) or Swing Low (support)
- Retest count — How many times this specific level has been tested
Understanding Retest Count
The retest count tracks how many times price has approached each historical level:
| Test # | Typical Significance |
|---|---|
| 1st test | Initial reaction — watch for bounce |
| 2nd test | Level is being recognized by the market |
| 3rd test | "Make or break" — often results in strong bounce or breakdown |
| 4th+ test | Level may be weakening — increased chance of breakthrough |
A 5-bar cooldown prevents the same approach from being counted multiple times when price hovers near a level.
 S/R Proximity alerts fire when price enters the tolerance zone around historical swing levels.
Use Cases
- Identify potential entry zones at tested support
- Watch for resistance tests during rallies
- Track which historical levels are being revisited
Setting Up Alerts in TradingView
SSI PRO alerts use TradingView's native alert system.
Tip: Every alert input now includes a descriptive tooltip. Hover over any alert checkbox in the settings panel to see exactly what it monitors and how it works.
Creating an Alert
- Ensure "Enable JSON Webhook" is OFF in indicator settings (for human-readable alerts)
- Right-click on the chart or click the Alert button
- Select "Any alert() function call" as the condition
- Configure alert actions (popup, email, mobile push, etc.)
- Set expiration and other TradingView options
- Create the alert
All enabled alert types (Swing Completion, Overbalance, Outside Bar, S/R Proximity) will fire through this single alert with their respective human-readable messages.
Alert Actions
TradingView supports multiple notification methods:
- Popup: On-screen notification
- Email: Sent to your registered email
- SMS: Text message (requires TradingView Premium)
- Webhook: HTTP POST to external URL
- Mobile Push: Notification to TradingView app
One Alert Per Type
Each alert type requires a separate TradingView alert. If you want both Swing Completion and Pr Overbalance alerts, create two alerts.
Webhook Integration
For automated systems, swing data can be sent via webhook in structured JSON format.
Enable JSON Webhook
Setting Name: Enable JSON Webhook
Location: Alerts section
Default: Off
When enabled:
- Swing completion sends structured JSON data
- All human-readable alerts are disabled (Overbalance, Outside Bar, S/R Proximity)
- Only JSON payloads are sent through the alert system
This is an either/or setting — you get human-readable alerts OR webhook JSON, not both from the same indicator instance.
See the Webhooks page for complete integration details.
Performance Considerations
Enabling any alert or export feature adds processing overhead — the indicator scans swing history on every bar to detect completions. When all alerts and export features are disabled, this scan is skipped entirely.
If you experience chart lag with alerts enabled, consider the dual-instance strategy: run one SSI PRO instance for visual analysis (all alerts OFF) and a second instance for alerts only (with "CSV Export Only" enabled to skip rendering). See the Performance page for details.
Alert Best Practices
Start Selective
Enable only the alerts you'll act on. Too many alerts leads to alert fatigue.
Set Meaningful Thresholds
A Px threshold of 50% will fire constantly. A threshold of 150% fires only on significant extensions. Choose thresholds that represent meaningful market events.
Match to Your Timeframe
Alerts on a 1-minute chart will fire frequently. Alerts on a daily chart fire less often but represent larger moves. Align your alert settings with your analysis timeframe.
Use S/R Proximity Sparingly
With a long history and tight tolerance, S/R Proximity can generate many alerts. Start with wider tolerance and shorter history, then tighten as needed.
Summary
SSI PRO alerts keep you informed when:
- Swing Completion: Structure changes with a new confirmed swing
- Overbalance: Metrics exceed your thresholds
- Outside Bar: Volatility expansion detected
- S/R Proximity: Price tests historical levels
Configure alerts through TradingView's native system, with optional webhook output for automated integration.