Get SSI PRO on your chart in under 3 minutes.
Step 1: Add the Indicator
- Open any chart in TradingView
- Click Indicators in the top toolbar
- Go to the Invite-Only tab
- Search for "Smart Swing Indicator PRO"
- Click to add it
Swing lines appear immediately.
 Add Smart Swing Indicator PRO from the Invite-Only tab.
Step 2: Read the Chart
Green lines — Upward swings (low to high)
Red lines — Downward swings (high to low)
Labels — Information at each swing point (price, range, ratios)
That's it. You're looking at the market's swing structure.
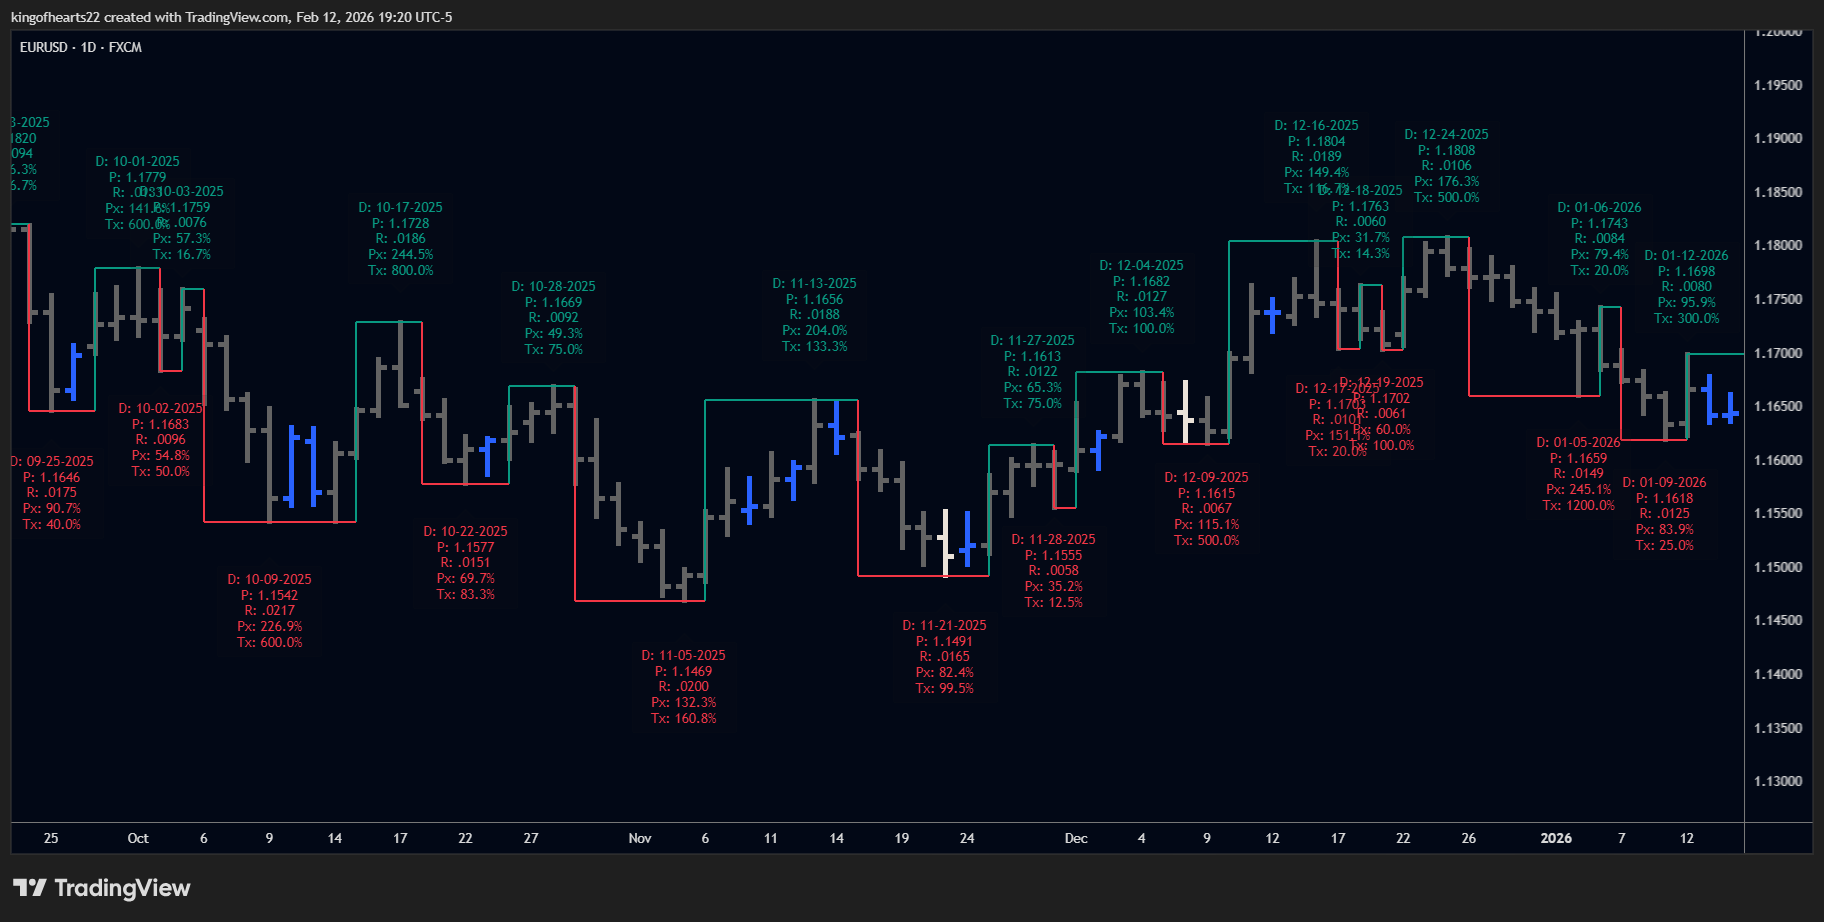 Green up, red down, labels at each turn.
Step 3: Adjust if Needed
Click the gear icon on the indicator to open settings.
Most users only adjust:
- Swing Period — Higher = fewer swings, more filtered (start with 1)
- Label slots — Choose what metrics appear on labels
Everything else works out of the box.
What's Next
- Overview — Understand the methodology
- Settings — All configuration options
- Metrics — What the label values mean
You're ready. The chart is showing you objective swing structure based on price action — no predictions, no signals, just what happened.