This page documents every setting in SSI PRO. Settings are organized into logical groups matching the indicator's settings panel in TradingView.
Swing Detection
These settings control the core swing logic — how the indicator identifies and confirms turning points.
Swing Period
Options: 1, 2, 3, 4, 5
Default: 1
The number of consecutive bars required to confirm a swing reversal.
- Period 1: Standard swing chart. Every directional change creates a new swing.
- Period 2: Requires two consecutive bars in the new direction. Filters single-bar noise.
- Period 3: Requires three consecutive bars. Reveals larger structural moves.
- Period 4-5: Progressively more filtered. Used for big-picture analysis.
Higher periods don't miss swings — they incorporate minor moves into larger ones. A 2-day chart still captures the full price range; it just marks fewer turning points.
OB Resolution Mode
Options: Mark as Continuation, Mark as Reversal, Skip Entirely
Default: Mark as Continuation
How outside bars (bars with higher high AND lower low than the previous bar) are displayed:
- Mark as Continuation: Places the intermediate swing at the bar before the outside bar. The traditional conservative approach.
- Mark as Reversal: Places the swing at the outside bar's extreme when structurally safe. Automatically falls back to Continuation when the pattern would create display issues or when chronologically invalid on higher timeframes.
- Skip Entirely: Omits the intermediate swing. Price continues in the prevailing direction without marking the outside bar's counter-move.
All three modes produce valid swing structures. Choose based on how much detail you want visible.
Higher Timeframe Note: On Weekly, Monthly, Quarterly, and Yearly charts, "Mark as Reversal" validates the chronological order of extremes within each bar. If the sequence doesn't support a reversal interpretation (e.g., on a yearly bar where the counter-move extreme occurred before the trend extreme), the indicator automatically uses Continuation mode instead. This ensures accurate time-based metrics and logical swing progression.
Gann's Exception Rule
Options: On, Off
Default: Off
When enabled, the indicator marks a swing when price exceeds a prior extreme — even if the required consecutive bars haven't fully confirmed yet.
This captures range that strict mechanical rules would miss. Most useful at Swing Period 2 or higher where the consecutive bar requirement might delay recognition of significant moves.
Line Appearance
These settings control how swing lines look on your chart.
Line Style
Options: Diagonal, Rectangular
Default: Diagonal
- Diagonal: Angled lines connecting each swing extreme directly
- Rectangular: Step pattern with horizontal and vertical segments
Diagonal is the traditional swing chart appearance. Rectangular can make time relationships more visible.
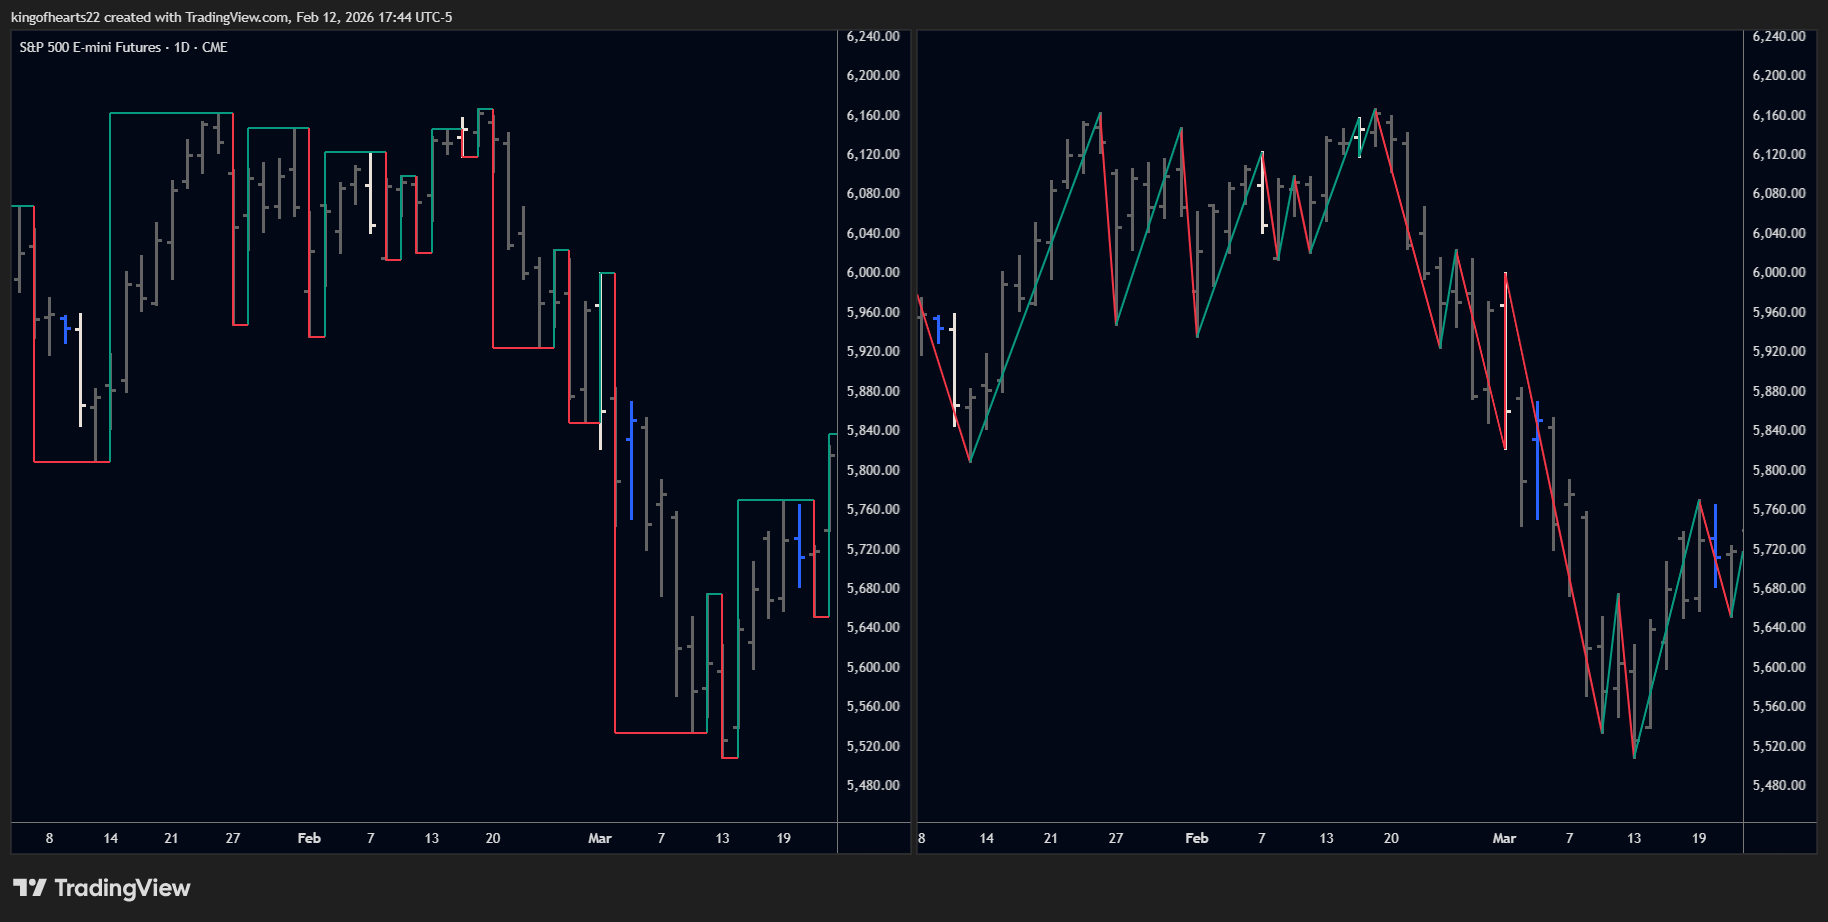 Diagonal vs Rectangular line styles.
Line Width
Options: 1-5
Default: 1
Thickness of the swing lines in pixels.
Line Type
Options: Solid, Dashed, Dotted
Default: Solid
Line pattern. Solid lines are cleanest; dashed or dotted can reduce visual weight when running multiple instances.
Color Mode
Options: Two-Color, Single
Default: Two-Color
- Two-Color: Up swings and down swings use different colors (green/red by default)
- Single: All swing lines use one color
Up Color / Down Color
Default: Green (#26a69a) / Red (#ef5350)
The colors for upward and downward swings. Only applies in Two-Color mode.
Single Color
Default: White
The color for all swing lines in Single color mode.
Line Transparency
Options: 0-100
Default: 0
Higher values make lines more transparent. Useful when layering multiple indicators.
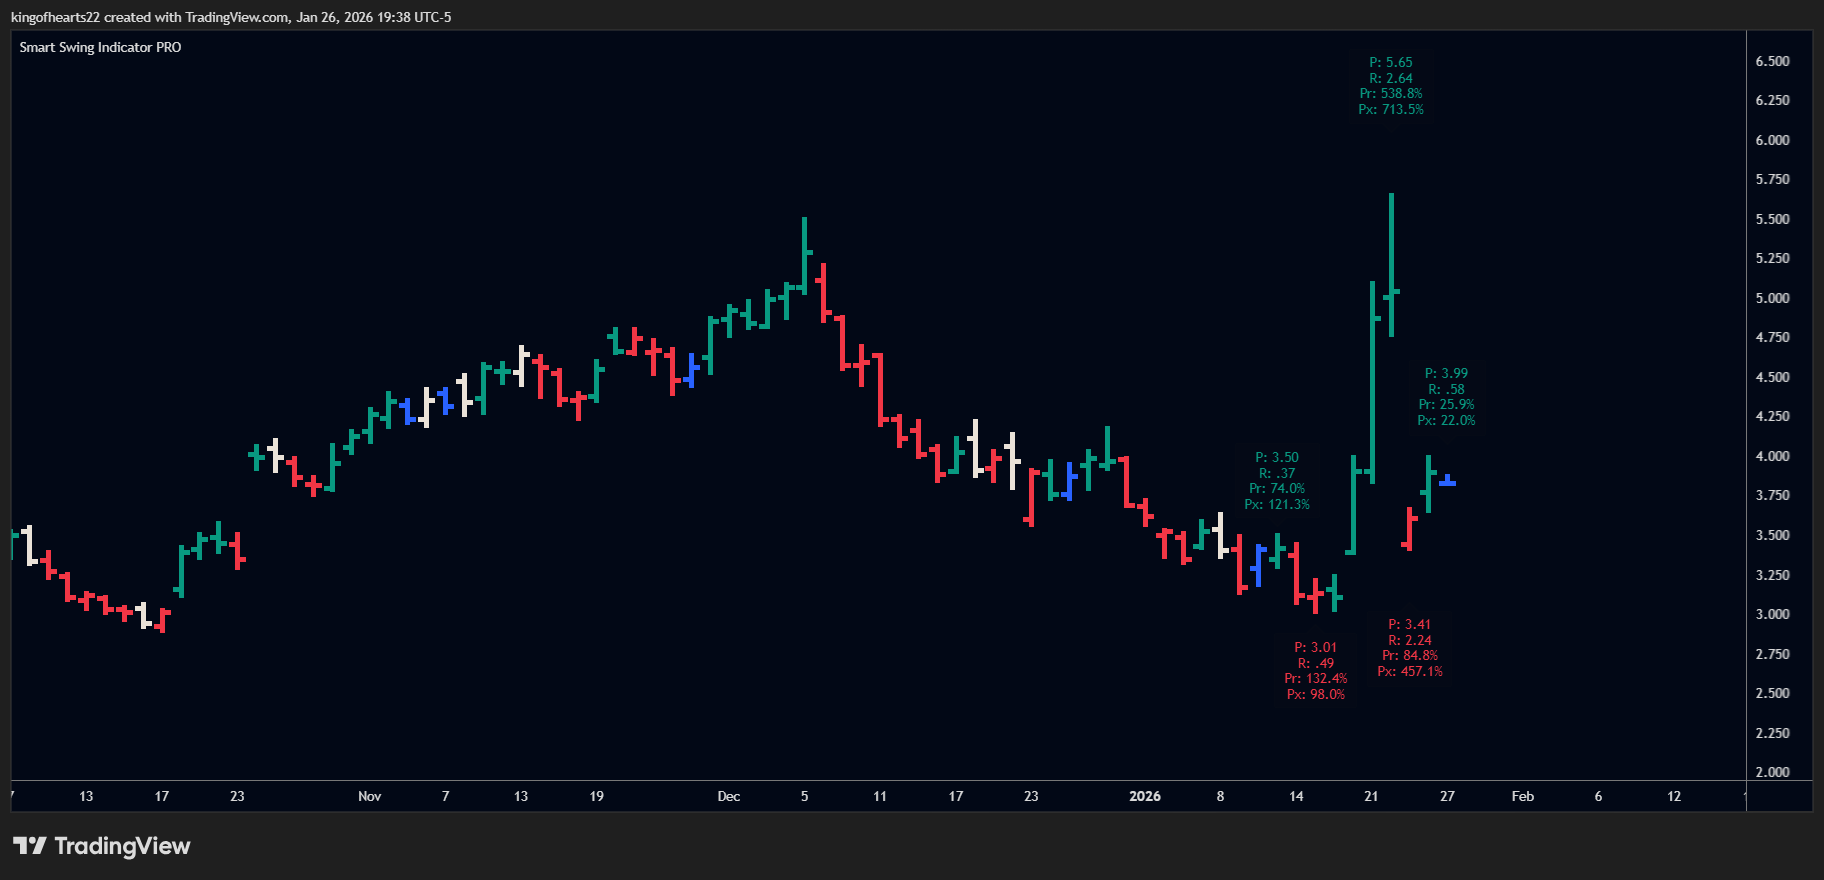
Label Configuration
SSI PRO labels display information at each swing point. You control what appears in up to 5 lines per label, plus tooltips for additional detail.
Label Slots 1-5
Options: (see Metrics list below)
Default: Range, Price, -, -, -
Each slot can display one metric or be left empty (-). Metrics appear in order from top to bottom on the label.
Available Metrics
| Metric | Description |
|---|---|
| Range | Absolute price distance of the swing |
| Price | Price at the swing extreme |
| Date | Timestamp of the swing (format configurable) |
| Pr | Price Retracement % — current range vs. previous opposite-direction swing |
| Px | Price Extension % — current range vs. previous same-direction swing |
| Bars | Number of bars in the swing |
| Time | Calendar time duration (shows days, weeks, or months contextually) |
| Tr | Time Retracement % — duration vs. previous opposite-direction swing |
| Tx | Time Extension % — duration vs. previous same-direction swing |
| Volume | Total volume during the swing |
| Vr | Volume Retracement % |
| Vx | Volume Extension % |
| VelB | Bar Velocity — range per trading bar |
| VelB-r | Bar Velocity Retracement % |
| VelB-x | Bar Velocity Extension % |
| VelC | Calendar Velocity — range per calendar day (includes weekends/gaps) |
| VelC-r | Calendar Velocity Retracement % |
| VelC-x | Calendar Velocity Extension % |
| - | Empty (no metric in this slot) |
See the Metrics page for detailed explanations of when and why each metric matters.
Date Format
Options: YYYY-MM-DD, MM/DD/YYYY, DD/MM/YYYY, MMM DD, DD MMM
Default: MMM DD
How dates appear in labels when Date is selected as a metric.
Tooltip Template
Options: None, Minimal, Standard, Full
Default: Standard
Tooltips appear when hovering over labels:
- None: No tooltip
- Minimal: Price and range only
- Standard: Core metrics (price, range, bars, P/R, P/X)
- Full: All available metrics for the swing
Tooltips let you keep labels clean while preserving access to detailed data.
 Tooltips display additional metrics on hover without cluttering your labels.
Label Display
These settings control how many labels appear and how they're positioned.
Max Labels Visible
Options: 10-500
Default: 50
The maximum number of labels rendered on the chart. TradingView limits total drawing objects; this setting helps manage performance on long histories.
Keep Hidden Labels
Options: On, Off
Default: On
When On, labels beyond the visible window are preserved (not deleted) so tooltips remain accessible when scrolling.
Max Up Labels / Max Down Labels
Options: 1-100
Default: 50 each
Separate limits for swing high labels and swing low labels. Useful when you want to see more of one type.
Label Size
Options: Auto, Tiny, Small, Normal, Large, Huge
Default: Auto
Label text size. Auto scales with chart zoom.
Bar Patterns
Optional highlighting for special bar types.
Inside Bar Color
Default: Blue (#2196f3)
Color applied to inside bars (bars contained within the previous bar's range). Set to transparent to disable highlighting.
Outside Bar Color
Default: Orange (#ff9800)
Color applied to outside bars. Set to transparent to disable.
Override Candle Colors
Options: On, Off
Default: Off
When On, inside/outside bar colors replace the candle's body color. When Off, highlighting appears as a background marker.
 Inside bars (blue) and outside bars (white) visually identified on the chart.
Alerts
SSI PRO can notify you when specific conditions occur.
Tip: Every alert input includes a descriptive tooltip explaining what it monitors. Hover over any checkbox or threshold input for details.
Swing Completion Alert
Triggers when a new swing high or swing low is confirmed. Alert includes the swing price, direction, and range.
Overbalance Alerts (Pr, Px, Tr, Tx, Vr, Vx)
Each overbalance metric has a configurable threshold. When a swing exceeds that threshold, an alert fires.
Example: Set "Px Threshold" to 100. When a swing extends beyond 100% of the previous same-direction swing, you receive an alert.
Alert includes:
- Swing direction (UP or DOWN)
- Current value vs previous value (points for price metrics, days for time metrics)
- Swing start date
This context helps you assess the significance of the overbalance without opening the chart.
Outside Bar Alert
Triggers when an outside bar is detected (before resolution).
Velocity Overbalance Alerts
Triggers when swing velocity exceeds your threshold.
Velocity Alert Mode
Options: Calendar, Trading Bars, Both
Default: Calendar
Controls which velocity calculation triggers alerts:
- Calendar: Uses range ÷ calendar days (real-world time including weekends)
- Trading Bars: Uses range ÷ bar count (chart time)
- Both: Alerts when either condition is met
Vel-x Threshold
Velocity Extension — compares to previous same-direction swing's velocity.
Vel-r Threshold
Velocity Retracement — compares to previous swing's velocity (any direction).
Alert includes:
- Which velocity mode triggered (Calendar or Bars)
- Swing direction (UP or DOWN)
- Percentage vs threshold
- Swing start date
 Velocity alerts can monitor calendar time, bar count, or both.
S/R Proximity Alert
Triggers when price approaches a previous swing extreme.
Configuration:
- Minimum Age: Only alert on swings at least N swings old
- Tolerance: How close price must be (points or percentage)
- Type: Support only, Resistance only, or Both
- Max History: How many swings back to check (50-500)
Alert includes:
- Historical date when the swing formed
- Days since the swing occurred
- Swing type (High/Low)
- Retest count (how many times this level has been tested)
The retest count uses a 5-bar cooldown to prevent double-counting when price hovers near a level.
Webhook Output
Alerts can include JSON-formatted data for integration with external systems. Enable "Webhook Format" to receive structured swing data.
CSV Export
SSI PRO adds columns to TradingView's CSV export for analysis in spreadsheets or other tools.
When enabled, export includes:
| Column | Content |
|---|---|
| ExtremeTimestamp | Unix timestamp of the swing extreme |
| ConfirmTimestamp | Unix timestamp when swing was confirmed |
| Timeframe | Chart timeframe |
| SwingPeriod | Swing period setting (1-5) |
| SwingType | "high" or "low" |
| SwingPrice | Price at the extreme |
| Pattern | Pattern code (0=regular, 1=ob_reversal, 2=ob_continuation, etc.) |
Export Mode
Options: Off, Basic, Full
Default: Off
- Off: No CSV columns added
- Basic: Price and direction only
- Full: All available swing data
Performance
Settings for chart rendering performance.
Draw Window
Options: 10-500 bars
Default: 100
How many bars beyond the visible chart area to include when drawing. Higher values ensure smooth scrolling; lower values improve performance.
Max Swing History
Options: 50-500
Default: 200
How many swings to keep in memory for ratio calculations and S/R proximity detection. Higher values enable deeper historical analysis at the cost of memory usage.
Auto Decimal Detection
SSI PRO automatically determines appropriate decimal precision based on the symbol:
| Market | Precision |
|---|---|
| Forex (except JPY) | 4 decimals |
| Forex JPY pairs | 2 decimals |
| Crypto > $100 | 2 decimals |
| Crypto $1-100 | 4 decimals |
| Crypto < $1 | 6 decimals |
| Stocks/Futures | 2 decimals |
| Currency Futures (6J, etc.) | 7 decimals |
| Copper | 4 decimals |
| Silver | 3 decimals |
This happens automatically — no configuration needed.
Next: Metrics
For detailed explanations of what each metric means and when to use it, see the Metrics page.