The Problem with Single Days
A single bar tells you what happened in one snapshot of time. But snapshots lie.
Markets don't move in straight lines. They zigzag, probe, test, and retrace — constantly. A daily chart might show three down bars in the middle of a roaring uptrend. Does that mean the trend reversed? Almost never. It means the market paused, shook out weak hands, and continued.
The challenge isn't detecting every direction change. It's detecting the ones that matter.
W.D. Gann addressed this directly in his 1950 coursebook:
"Long years of experience have proved that the Daily High and Low Chart does not give the best indication of a change in trend, because one day is too short a period of time."
One day is noise. Two days starts to mean something. Three days means more.
What Swing Period Controls
The Swing Period setting determines how many consecutive bars must confirm a direction before the indicator marks a swing reversal.
| Period | Requirement | Effect |
|---|---|---|
| 1 | Any directional bar | Most sensitive, captures all swings |
| 2 | Two consecutive bars | Filters single-bar fakeouts |
| 3 | Three consecutive bars | Reveals larger structural moves |
| 4-5 | Four or five consecutive bars | Big-picture analysis only |
At Period 1, every qualified direction change creates a new swing. At Period 3, the market must commit to a direction for three bars before the indicator acknowledges the turn.
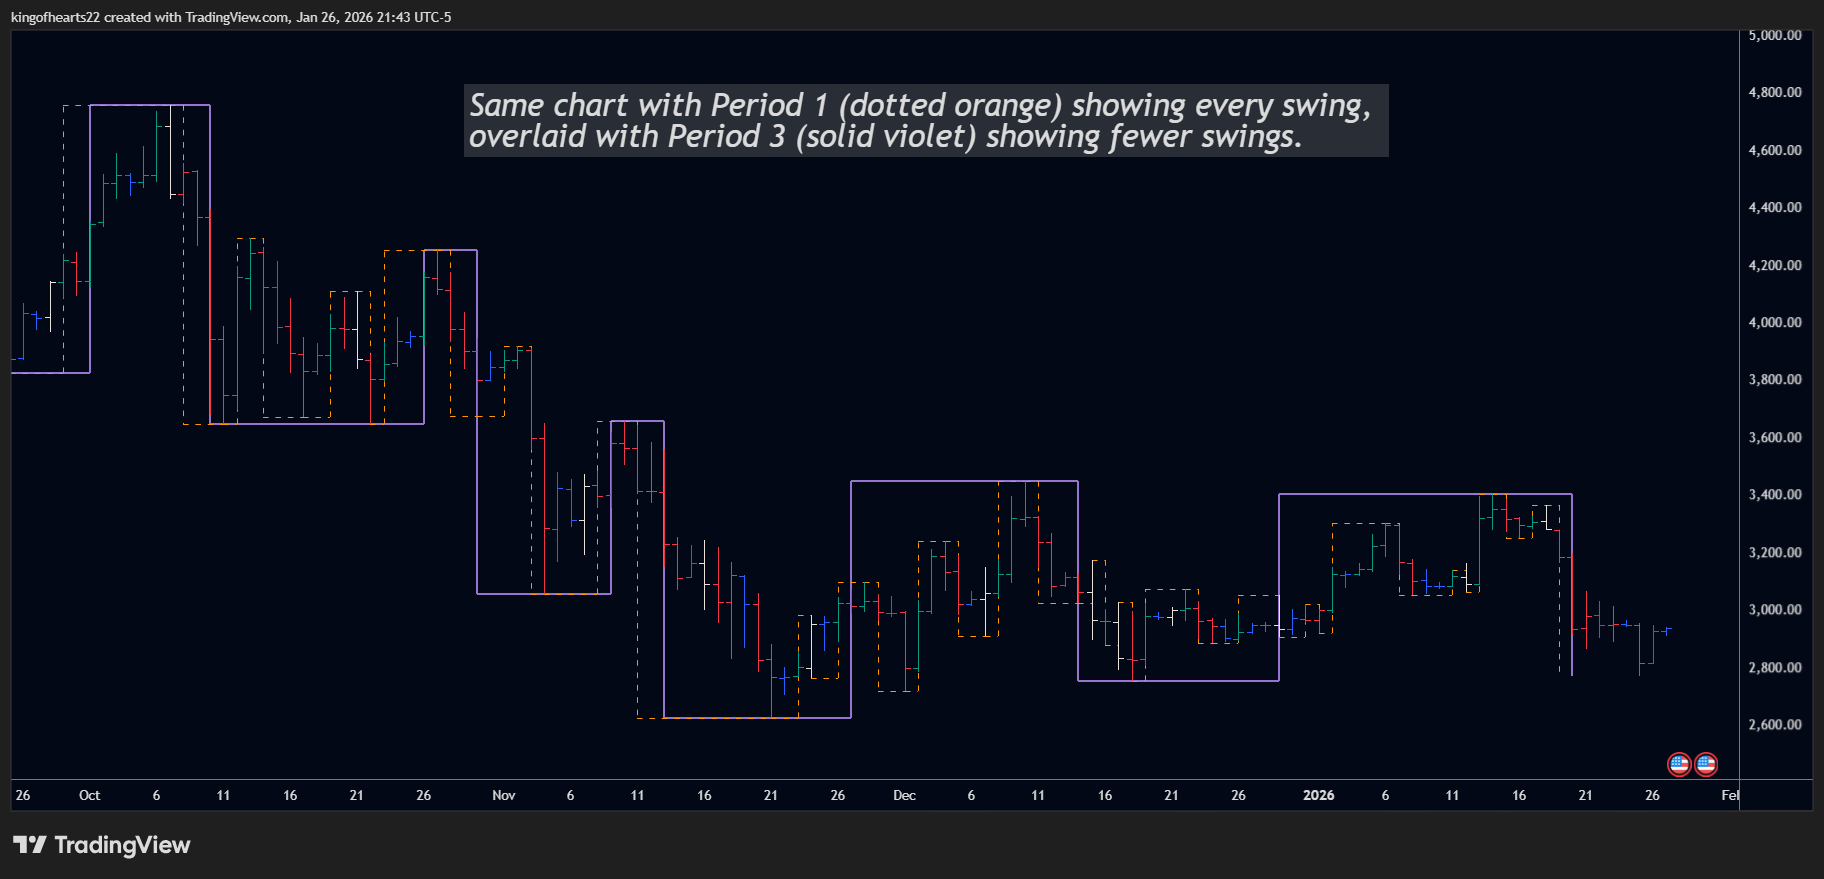 Period 1 captures every turn. Period 3 filters noise to show structure.
The Mechanics
When Swing Period is set to 2 or higher, the indicator waits for confirmation before marking a reversal.
Example: Period 2, Uptrend
- Market is in an uptrend (higher highs, higher lows)
- First down bar appears (lower high AND lower low)
- Indicator does NOT mark a reversal yet — it waits
- Second consecutive down bar appears
- NOW the indicator marks the swing high (at the actual extreme, which was the bar before the first down bar)
The reversal is marked retroactively at the true extreme, not at the confirmation bar. This preserves accurate range measurement.
 Period 2 waits for two consecutive bars before confirming the reversal.
Why Higher Periods Work
Gann documented the practical value using July Soybeans from 1949-1950:
2-Day Chart Results:
- Six clear swings up, each with higher bottoms and higher tops
- Stop-loss placement just below 2-day bottoms captured the complete move
- Nearly $1 per bushel profit on the entire run
What the 2-Day Chart Filtered:
- March 27-30: 16¢ decline over 3 days (the deepest retracement in time and price)
- April 25-27: 11¢ decline over 2 days (smaller than previous — no reversal signal)
- May 3-5: 19¢ decline over 2 days (exceeded price but not time of March decline)
The 2-day chart kept traders in the position through all these pullbacks because none of them met the criteria for a confirmed reversal.
"Never guess; follow rules and wait for a definite indication before you make a trade." — W.D. Gann, 1950
Choosing Your Period
There's no universally "correct" setting. The right period depends on what you're trying to see.
Period 1: Precision Trading
- See every qualified swing
- Useful for short-term timing
- More swings = more potential entry/exit points
- Also more noise
Period 2: Balanced View
- Filters single-bar fakeouts
- Still captures meaningful turns
- Good default for most analysis
- Gann's preferred minimum for serious analysis
Period 3: Structural Analysis
- Reveals major trend sections
- Fewer but more significant swings
- Better for position trading timeframes
- May miss fast reversals
Period 4-5: Big Picture Only
- Shows only sustained directional moves
- Best combined with lower periods for context
- Useful for identifying major support/resistance
- Too filtered for active trading decisions
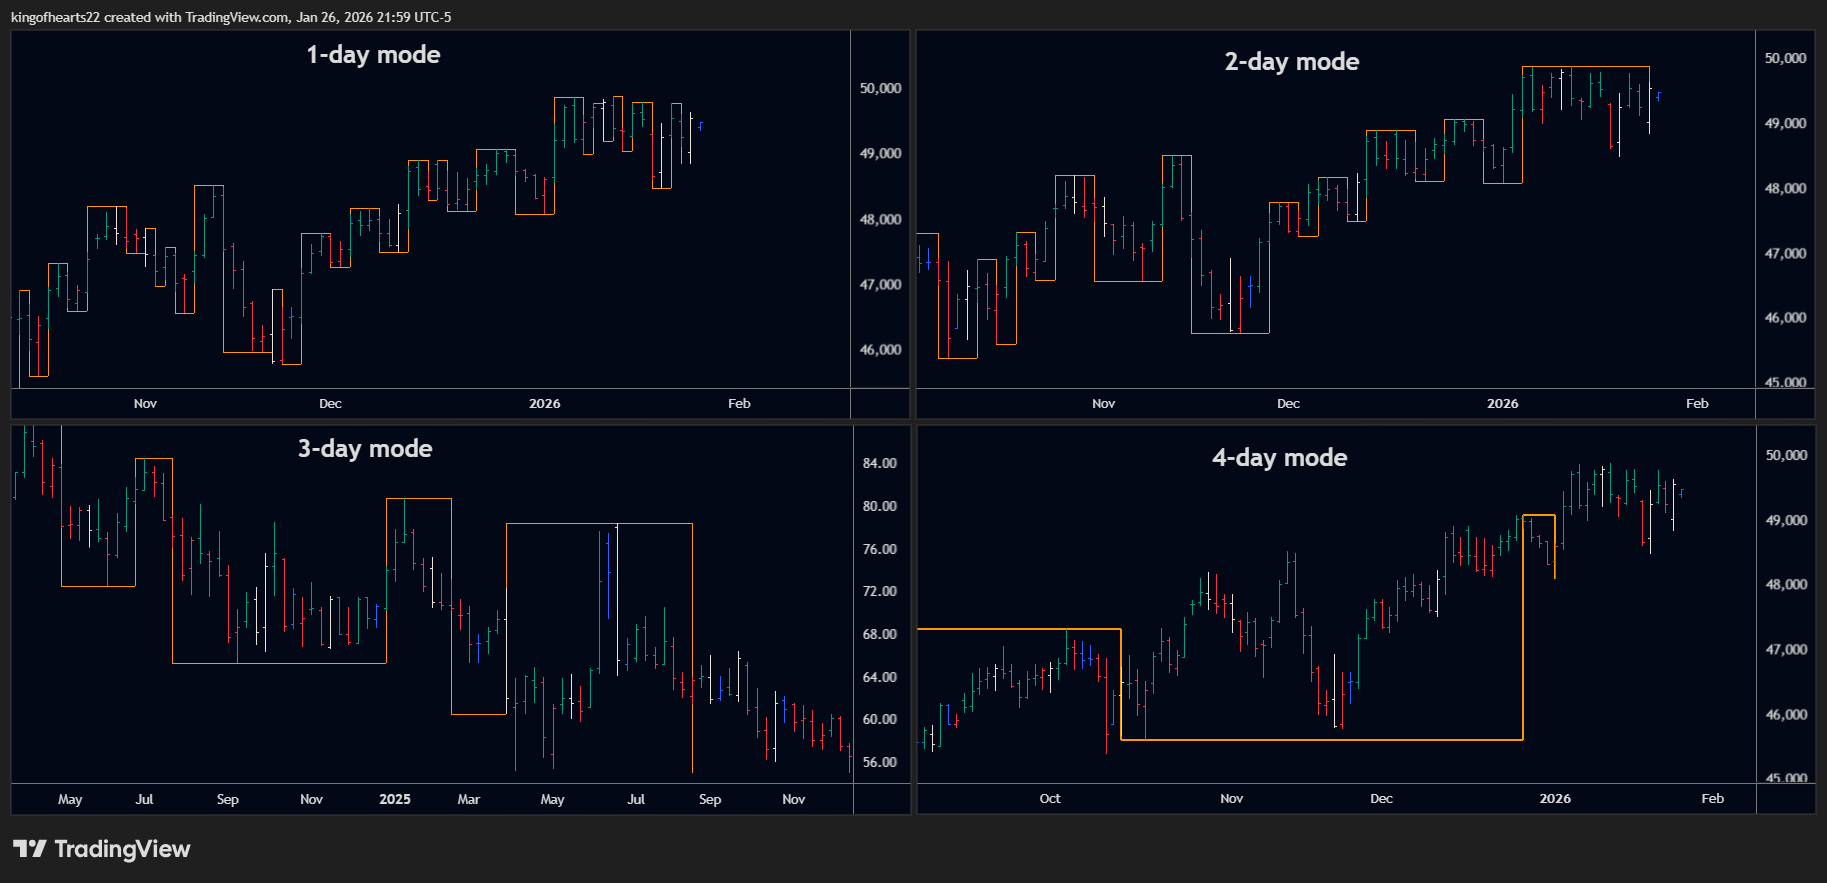 The same market at four different swing periods reveals different structural layers.
Wheels Within Wheels
Professional swing analysts don't pick one period and ignore the rest. They run multiple periods simultaneously.
The Concept:
- Period 1 shows tactical swings
- Period 2 shows intermediate structure
- Period 3 shows major sections
- Each layer provides context for the others
When a Period 1 swing aligns with a Period 3 swing in the same direction, that's a stronger signal than Period 1 alone. When Period 1 shows a reversal but Period 3 is still trending, that's context about where you are in the larger structure.
Practical Setup: Run SSI PRO multiple times on the same chart with different periods and colors:
- Instance 1: Period 1, thin lines
- Instance 2: Period 2, medium lines
- Instance 3: Period 3, thick lines
The visual layering reveals the "wheels within wheels" — smaller cycles operating inside larger ones.
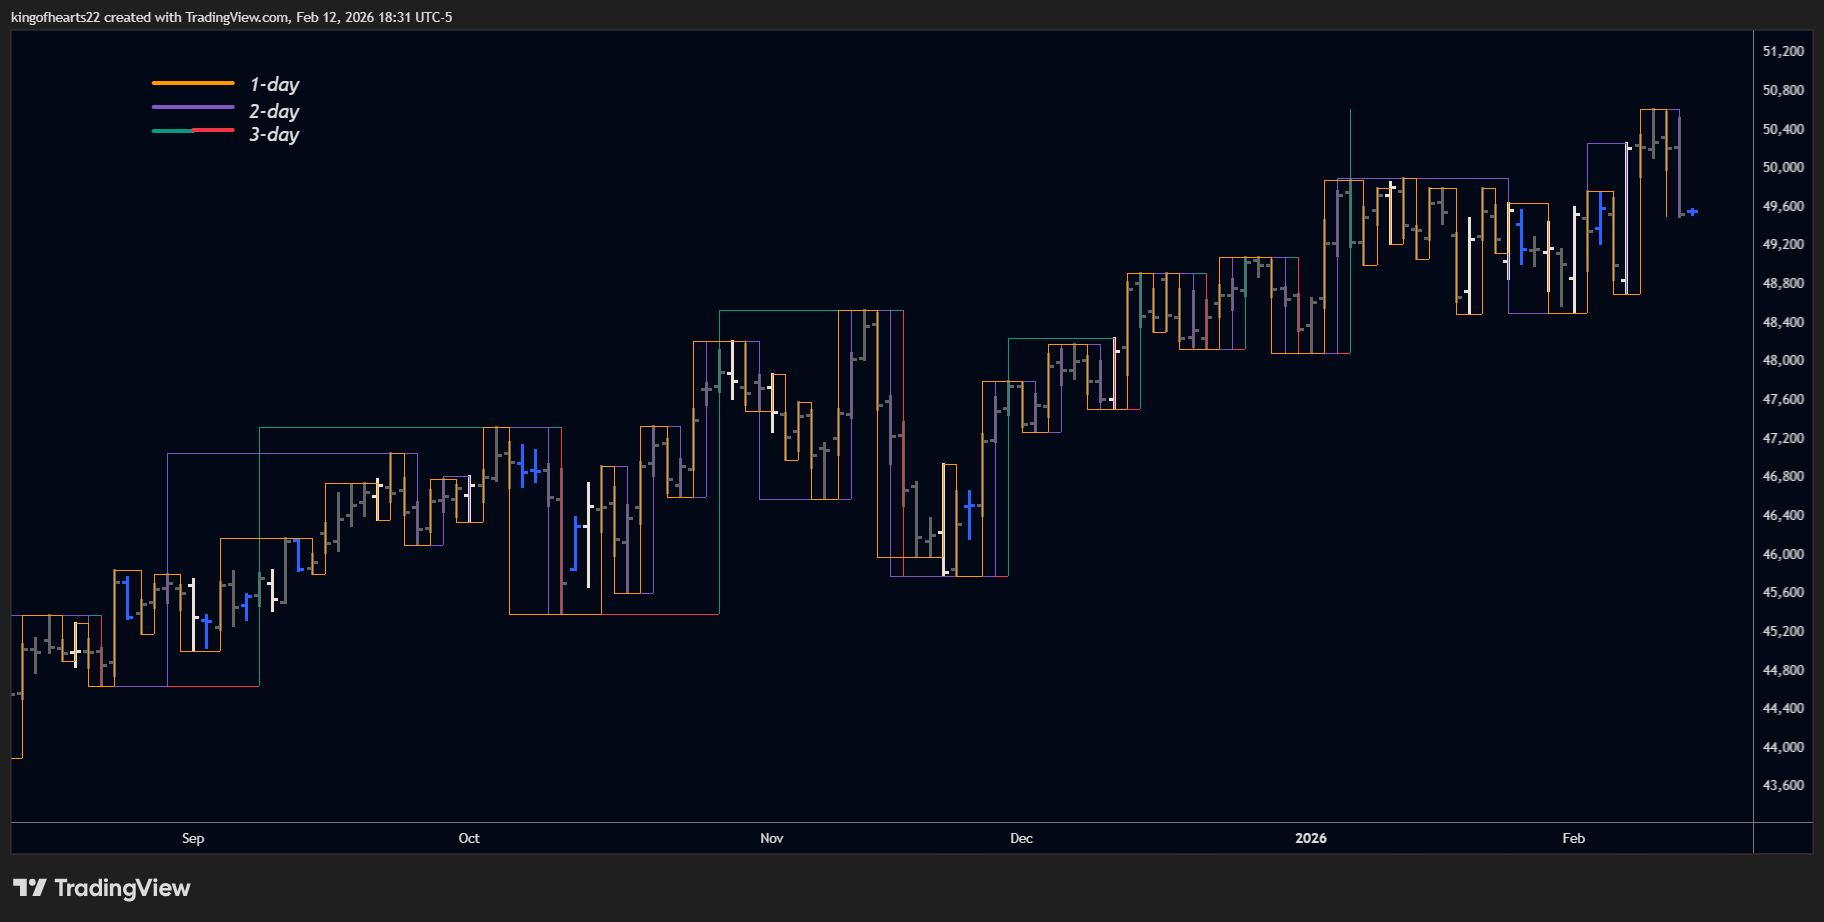 Multiple swing periods reveal nested market structure.
Multi-Day Swings and Range
Higher periods don't miss price movement — they incorporate it differently.
A Period 3 swing that runs from 100 to 150 captures the complete 50-point range, even if there were multiple Period 1 swings inside that move. The Period 3 chart shows one swing; the Period 1 chart shows perhaps five swings that net to the same 50 points.
Both are accurate. They're measuring the same market at different resolutions.
This matters for:
- Milestone projections: Larger swings produce larger percentage targets
- Overbalance analysis: Comparing swings at the same period gives meaningful ratios
- Support/resistance: Higher-period extremes often mark more significant levels
Combining with Gann's Exception Rule
When using Period 2 or higher, consider enabling Gann's Exception Rule.
The Exception Rule captures situations where price exceeds a prior extreme but doesn't run the required consecutive bars. Without it, strict mechanical rules might miss portions of the market's actual range.
See the Gann's Exception Rule page for complete details.
Summary
Multi-day swings filter noise by requiring consecutive confirmation:
- Period 1: Every swing, maximum detail
- Period 2+: Filtered view, structural clarity
- Multiple periods: Layered analysis revealing nested cycles
The right period isn't about finding the "best" setting — it's about matching your analysis timeframe to the market structure you want to see.
Gann's core insight remains true: one day is often too short to indicate a real change in trend. The question is how many days you need to see before taking action.