Taking Swing Data Offline
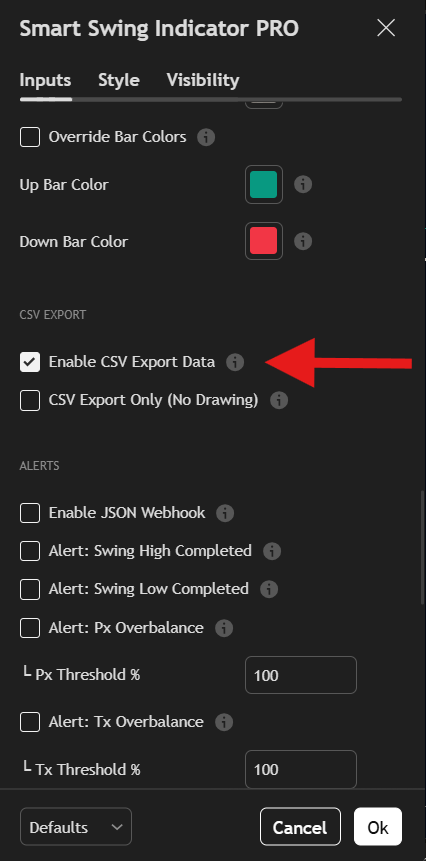
The chart shows you structure visually. CSV export gives you the raw data for analysis in spreadsheets, databases, or custom tools.
SSI PRO exports swing data through TradingView's native "Export chart data" functionality, adding swing-specific columns to the standard OHLC output.
How to Export
- Open your chart with SSI PRO applied
- Click the camera/snapshot icon in the top toolbar
- Select "Export chart data"
- Choose your date range
- Save the CSV file
The export includes every bar in the selected range, with swing data populated on bars where swings completed.
 Export chart data from the snapshot menu.
CSV Column Definitions
The export contains TradingView's standard columns plus SSI PRO swing data:
Standard Columns (TradingView)
| Column | Type | Description |
|---|---|---|
time | Date | Bar timestamp |
open | Float | Bar open price |
high | Float | Bar high price |
low | Float | Bar low price |
close | Float | Bar close price |
Swing Columns (SSI PRO)
| Column | Type | Description |
|---|---|---|
BarIndex | Integer | TradingView bar index where swing was confirmed |
ExtremeTimestamp | Unix ms | When the swing extreme actually occurred |
ConfirmTimestamp | Unix ms | When the swing was confirmed |
Timeframe | Integer | Chart timeframe in minutes |
SwingPeriod | Integer | Swing period setting (1, 2, 3, etc.) |
SwingType | Integer | Direction: 1 = High, -1 = Low |
SwingPrice | Float | Price at the swing extreme |
Pattern | Integer | How the swing formed (see Pattern Codes) |
Note: BarIndex is useful for correlating swings with specific chart bars when importing data into external analysis tools.
Understanding the Two Timestamps
Each swing has two timestamps that may differ:
ExtremeTimestamp: When the actual high or low occurred. This is the bar where price reached the extreme.
ConfirmTimestamp: When the swing was confirmed as final. This is always >= ExtremeTimestamp because confirmation happens after the extreme forms.
For regular reversals, these are often the same bar. For outside bar patterns or multi-day swings, the extreme may have occurred 1-2 bars before confirmation.
Why this matters:
- Use ExtremeTimestamp for accurate time-based analysis
- Use ConfirmTimestamp for trade timing (when you would have known)
- The difference reveals confirmation lag
Pattern Codes
The Pattern column indicates how each swing was formed:
| Code | Name | Description |
|---|---|---|
0 | Regular | Normal direction change reversal |
1 | OB Reversal | Outside bar that reversed the trend |
2 | OB Continuation | Outside bar continuation (zigzag pattern) |
3 | False OB | Outside bar that was invalidated |
4 | Engulfing Reversal | Engulfing pattern reversal |
5 | Engulfing Continuation | Engulfing pattern continuation |
Pattern codes help you analyze how different swing formations behave in your market.
Timeframe Values
The Timeframe column uses minutes as the unit:
| Chart | Minutes |
|---|---|
| 1 minute | 1 |
| 5 minutes | 5 |
| 15 minutes | 15 |
| 30 minutes | 30 |
| 1 hour | 60 |
| 4 hours | 240 |
| Daily | 1440 |
| Weekly | 10080 |
| Monthly | 43200 |
| Quarterly | 129600 |
| Yearly | 525600 |
This allows you to combine exports from multiple timeframes while tracking which timeframe each swing came from.
 CSV Export workflow exporting to Excel.
Working with the Data
Filtering to Swings Only
Most rows contain only OHLC data with NaN/empty swing columns. These are regular bars where no swing completed.
Filter to swing rows only:
Excel/Sheets: Filter SwingType column to exclude blanks
Python:
import pandas as pd

df = pd.read_csv('export.csv')
swings = df[df['SwingType'].notna()]
R:
swings <- subset(data, !is.na(SwingType))Verifying Alternation
Valid swing data must alternate between High (1) and Low (-1). Check this in your analysis:
# Verify alternation
swing_types = swings['SwingType'].tolist()
for i in range(1, len(swing_types)):
    if swing_types[i] == swing_types[i-1]:
        print(f"Alternation violation at row {i}")
If you see consecutive same-direction swings, there may be a data issue.
Converting Timestamps
Timestamps are Unix milliseconds. Convert to readable dates:
Python:
from datetime import datetime

extreme_ms = 1731801600000
extreme_date = datetime.fromtimestamp(extreme_ms / 1000)
JavaScript:
const extreme_ms = 1731801600000;
const extreme_date = new Date(extreme_ms);
Excel:
=A1/86400000 + DATE(1970,1,1)
(Format the cell as Date/Time)
OB Continuation and Zigzag Exports
When an outside bar continuation pattern occurs, two swings are created:
- First swing — the peak/trough before the outside bar
- Second swing — the outside bar's opposite extreme (the zigzag leg)
These appear on consecutive rows in the CSV, even though they may reference the same or adjacent bars. This maintains the one-row-per-bar constraint while capturing both legs of the pattern.
Example:
time,SwingType,SwingPrice,Pattern
2024-09-01,1,19.34,2
2024-09-02,-1,18.86,2
Row 1: Swing High at 19.34, OB Continuation pattern Row 2: Swing Low at 18.86, OB Continuation pattern (zigzag leg)
Both rows show Pattern code 2, indicating they're part of the same OB Continuation sequence.
Building a Swing Database
CSV export is ideal for initial database population or periodic full refreshes.
Suggested Workflow
- Export historical data — Full chart history
- Import to database — Parse CSV and insert rows
- Normalize timestamps — Convert to your preferred format
- Add indexes — On symbol, timeframe, extreme_timestamp
- Maintain with webhooks — Use JSON webhooks for real-time updates
For real-time ongoing updates, see the Webhooks page.
Database Schema Example
CREATE TABLE swings (
    id SERIAL PRIMARY KEY,
    symbol VARCHAR(20),
    timeframe_minutes INTEGER,
    swing_period INTEGER,
    swing_type INTEGER,
    swing_price DECIMAL(18, 8),
    extreme_timestamp BIGINT,
    confirm_timestamp BIGINT,
    pattern INTEGER,
    created_at TIMESTAMP DEFAULT NOW(),

    UNIQUE(symbol, timeframe_minutes, swing_period, extreme_timestamp, swing_type)
);
The unique constraint prevents duplicate entries if you re-import the same data.
Summary
CSV export provides complete swing data for offline analysis:
- All swing points with price, time, and pattern information
- Two timestamps (extreme vs confirmation) for accurate analysis
- Pattern codes revealing how each swing formed
- Timeframe tagging for multi-timeframe databases
Use CSV for initial data population and historical analysis. Combine with webhooks for real-time updates.