SSI PRO can display 16 different metrics on swing labels. This page explains what each metric measures and why it matters.
Metrics fall into four categories:
- Basic: Raw values (price, range, bars)
- Price Ratios: Comparing price movement to previous swings
- Time Ratios: Comparing duration to previous swings
- Volume/Velocity Ratios: Comparing activity and pace to previous swings
Understanding Ratios
Before diving into individual metrics, understand how ratios work in swing analysis.
Every swing can be compared to previous swings in two ways:
-
Retracement (R): Compare to the previous opposite-direction swing. An up swing's P/R compares it to the down swing that preceded it. This measures how much the market "gave back" or retraced.
-
Extension (X): Compare to the previous same-direction swing. An up swing's P/X compares it to the prior up swing. This measures whether the current move is bigger or smaller than the last move in this direction.
These ratios are expressed as percentages:
- 50% means the current swing is half the size of the reference swing
- 100% means they're equal
- 150% means the current swing is 50% larger than the reference
Ratios apply to price, time, volume, and velocity. The patterns they reveal are consistent across all four dimensions.
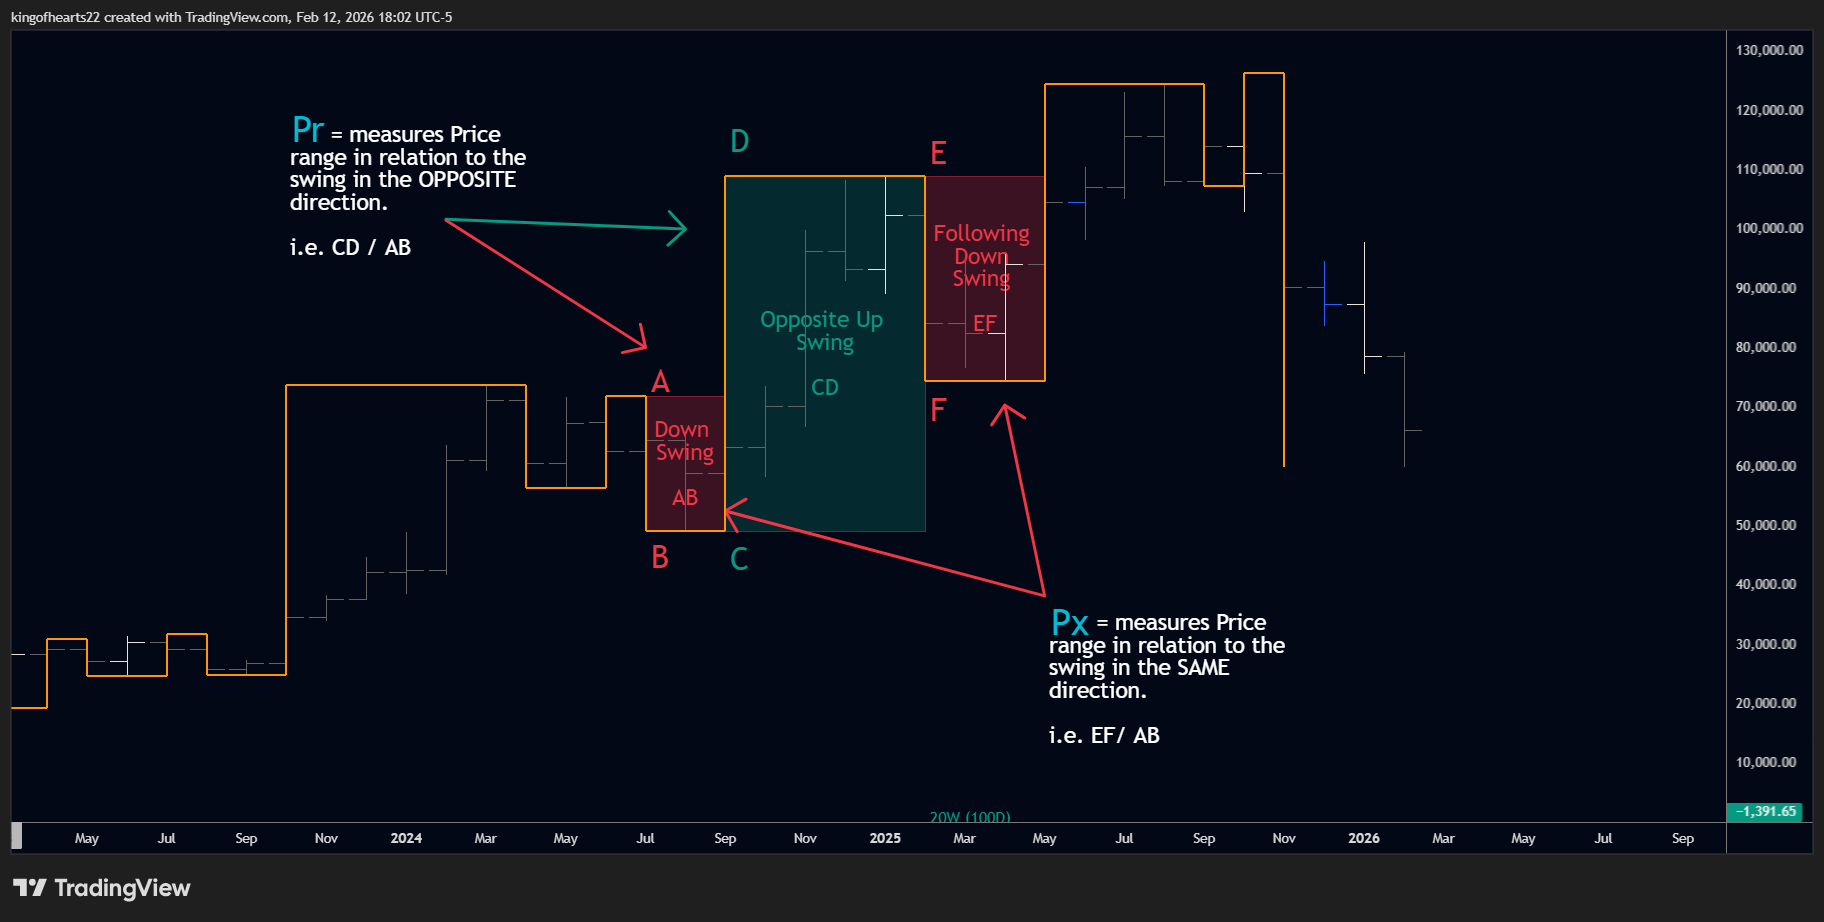 Pr compares to the previous opposite-direction swing. Px compares to the previous same-direction swing.
Basic Metrics
Range
The absolute price distance from swing start to swing extreme.
Calculation: |Extreme Price - Start Price|
Why it matters: Range tells you the size of the move in concrete terms. A 50-point swing means something different on a $100 stock versus a $10 stock, but within a single instrument, comparing ranges reveals whether moves are expanding or contracting.
Watch for: Expanding ranges in your direction suggest momentum. Contracting ranges suggest exhaustion.
Price
The price level at the swing extreme.
Calculation: High price for swing highs, low price for swing lows
Why it matters: This is the "where" — the exact level the market reached before reversing. Price labels turn your swing chart into a reference map of significant levels.
Watch for: Prices that cluster near previous swing levels indicate support/resistance zones.
Date
The timestamp when the swing extreme occurred.
Calculation: Date/time of the bar containing the extreme
Why it matters: Time context helps identify patterns that repeat on calendars — monthly turns, quarterly cycles, anniversary dates.
Format options: YYYY-MM-DD, MM/DD/YYYY, DD/MM/YYYY, MMM DD, DD MMM
Bars
The number of bars in the swing.
Calculation: Count of bars from swing start to swing extreme
Why it matters: Bars measure "chart time" — how many periods passed during the move. Combined with Range, this gives you Velocity.
Watch for: A swing that covers large range in few bars is aggressive. Many bars for small range suggests grinding, uncertain movement.
Time
Calendar duration of the swing.
Calculation: Actual days/weeks/months between swing start and extreme
Why it matters: Bars can mislead because markets close. A 5-bar swing on a daily chart might span a week or more depending on holidays. Time shows the real-world duration.
Display: SSI PRO automatically formats based on magnitude:
- Hours/minutes for intraday
- Days for daily charts
- Weeks for swings lasting weeks
- Months for longer-term moves
Volume
Total volume traded during the swing.
Calculation: Sum of volume for all bars in the swing
Why it matters: Volume reveals participation. High volume during a move suggests conviction; low volume suggests the move may lack support.
Note: Volume requires volume data from your data provider. Some instruments don't report volume.
Velocity
How fast price moved during the swing. SSI PRO offers two velocity calculations:
Bar Velocity (VelB): Range ÷ Bars
Measures speed in chart time — how many trading bars elapsed.
Calendar Velocity (VelC): Range ÷ Calendar Days
Measures speed in real-world time — includes weekends, holidays, and gaps.
Why both matter: A swing that spans a 3-day weekend shows the same bar count as one during mid-week, but the calendar time differs significantly. VelB tells you chart-based momentum; VelC tells you real-world pace.
Display formats: VelC adapts to timeframe:
- Daily and higher:
/d(per day) - Hourly:
/h(per hour) - Sub-hourly:
/m(per minute)
Watch for: Sharp velocity increases often mark climactic moves. Declining velocity during a trend suggests weakening. Divergence between VelB and VelC can reveal gap effects or weekend impacts.
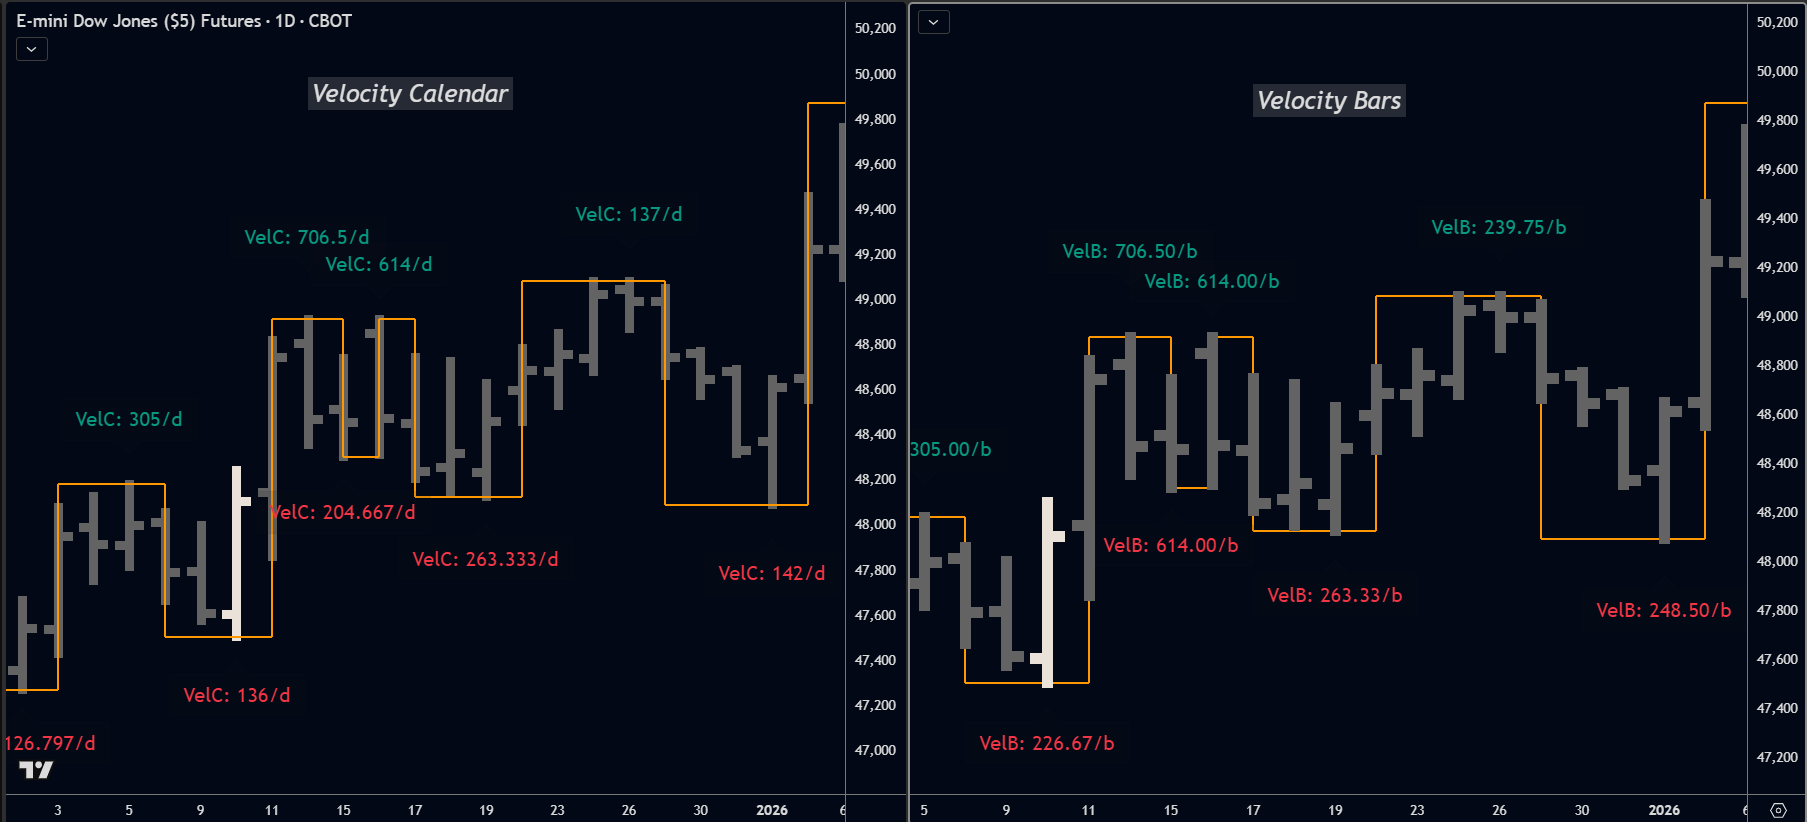 Bar velocity counts trading sessions; calendar velocity includes all elapsed time.
Price Ratios
Pr (Price Retracement)
How this swing's range compares to the previous opposite-direction swing.
Calculation: (Current Range ÷ Previous Opposite Range) × 100
Example: Down swing covers 80 points. Following up swing covers 60 points. Pr = 75%.
Why it matters: Pr tells you how much the market "gave back." Shallow retracements (30-50%) in an uptrend suggest buyers are eager and not waiting for deep pullbacks. Deep retracements (70-85%) suggest sellers are fighting hard.
Key levels:
- 50%: Halfway back — often a decision point
- 61.8%/38.2%: Fibonacci proportions many traders watch
- 100%: Full retracement — the entire previous move was erased
Px (Price Extension)
How this swing's range compares to the previous same-direction swing.
Calculation: (Current Range ÷ Previous Same-Direction Range) × 100
Example: First up swing covers 50 points. Second up swing covers 75 points. Px = 150%.
Why it matters: Px reveals trend health. When each swing in a direction exceeds the previous one (Px > 100%), the trend is expanding. When swings shrink (Px < 100%), momentum is fading.
Key levels:
- 100%: Equal to the previous move — a natural target
- 150-200%: Strong expansion — trend is accelerating
- < 75%: Significant contraction — possible exhaustion
Time Ratios
Tr (Time Retracement)
How this swing's duration compares to the previous opposite-direction swing.
Calculation: (Current Time ÷ Previous Opposite Time) × 100
Why it matters: Time retracement adds a dimension price alone misses. A market that retraces 50% of price in 100% of time is behaving differently than one that retraces 50% of price in 25% of time. The first is measured; the second is aggressive.
Watch for: Quick retracements (low Tr) often precede continuation. Slow retracements (high Tr relative to Pr) suggest the counter-move has conviction.
Tx (Time Extension)
How this swing's duration compares to the previous same-direction swing.
Calculation: (Current Time ÷ Previous Same-Direction Time) × 100
Why it matters: Like Px, but for time. If an uptrend's second leg takes twice as long (Tx = 200%) to cover similar ground, the pace is slowing even if price isn't.
Watch for: Tx and Px divergence. If Px is 150% but Tx is 200%, the range expanded but velocity dropped. The move is bigger but slower.
Volume Ratios
Vr (Volume Retracement)
How this swing's volume compares to the previous opposite-direction swing.
Calculation: (Current Volume ÷ Previous Opposite Volume) × 100
Why it matters: Volume on retracements reveals conviction. Low volume retracements (Vr < 50%) suggest counter-trend participants are weak. High volume retracements suggest serious selling/buying.
Vx (Volume Extension)
How this swing's volume compares to the previous same-direction swing.
Calculation: (Current Volume ÷ Previous Same-Direction Volume) × 100
Why it matters: Expanding volume with expanding price (high Px, high Vx) is healthy trend behavior. Expanding price with contracting volume (high Px, low Vx) is a warning sign — the move is happening on less participation.
Velocity Ratios
VelB-r / VelC-r (Velocity Retracement)
How this swing's velocity compares to the previous opposite-direction swing.
Calculation:
- VelB-r: (Current Bar Velocity ÷ Previous Opposite Bar Velocity) × 100
- VelC-r: (Current Calendar Velocity ÷ Previous Opposite Calendar Velocity) × 100
Why it matters: Velocity retracement tells you about the character of the pullback. A retracement that moves slowly (low Vel-r) might just be consolidation. One that moves fast (high Vel-r) suggests urgency.
VelB-r vs VelC-r: Use VelB-r for pure chart analysis. Use VelC-r when real-world time matters — for example, a pullback that took 5 trading days but spanned 9 calendar days (including a holiday week) shows different urgency than one that took 5 trading days in 5 calendar days.
VelB-x / VelC-x (Velocity Extension)
How this swing's velocity compares to the previous same-direction swing.
Calculation:
- VelB-x: (Current Bar Velocity ÷ Previous Same-Direction Bar Velocity) × 100
- VelC-x: (Current Calendar Velocity ÷ Previous Same-Direction Calendar Velocity) × 100
Why it matters: The ultimate momentum indicator. If each leg of an uptrend moves faster than the last (Vel-x > 100%), buyers are increasingly aggressive. Declining velocity extension (Vel-x < 100%) suggests the trend is grinding.
VelB-x vs VelC-x: Both reveal trend health, but from different angles. A move with VelB-x of 120% but VelC-x of 80% covered more ground per bar but took longer in real time — possibly due to gaps or extended sessions. Reading both gives you the complete picture.
Combining Metrics
The real power emerges when you read metrics together.
Healthy uptrend characteristics:
- Px > 100% (expanding price moves up)
- Pr < 50% (shallow pullbacks)
- Vel-x > 100% (increasing speed)
- Vel-r < 75% (slow pullbacks)
Exhaustion warning signs:
- Px declining over successive swings
- Pr increasing (deeper pullbacks)
- Vx declining while Px holds (less participation)
- Velo-x declining (slowing momentum)
Potential reversal setup:
- Pr > 75% (deep retracement)
- Velo-r > 100% (fast counter-move)
- Failing to make new extremes
These are patterns, not signals. SSI PRO shows you the data; interpretation is yours.
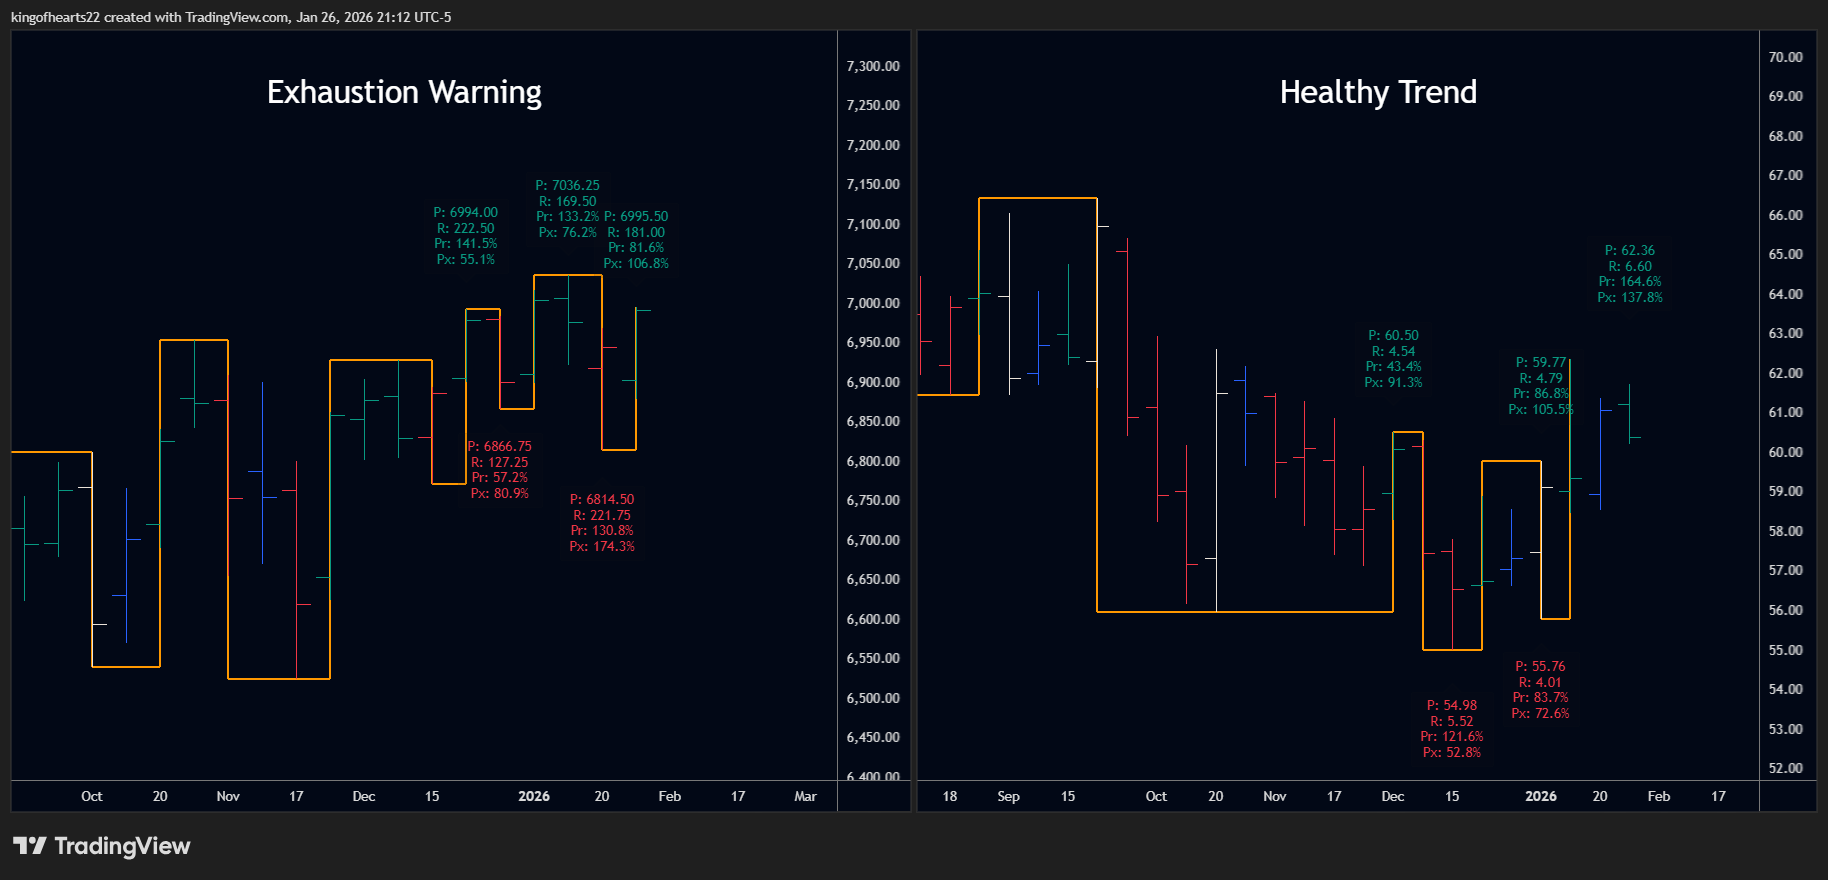 Reading metrics together reveals trend health. Left: warning signs. Right: expanding momentum.
Choosing What to Display
You have 5 label slots. Here are common configurations:
Minimal:
- Range
- (empty)
- (empty)
- (empty)
- (empty)
Price-Focused:
- Price
- Range
- Pr
- Px
- (empty)
Time Analysis:
- Date
- Bars
- Time
- Tr
- Tx
Full Ratio View:
- Pr
- Px
- Tr
- Tx
- (tooltip: Full)
Volume Emphasis:
- Range
- Volume
- Vr
- Vx
- Velocity
Remember: tooltips can display additional metrics without cluttering your labels. Use "Standard" or "Full" tooltip templates to access everything on hover.
Summary
| Metric | Compares | Measures |
|---|---|---|
| Range | - | Size of move |
| Price | - | Level reached |
| Date | - | When it happened |
| Bars | - | Chart periods elapsed |
| Time | - | Calendar duration |
| Volume | - | Total activity |
| VelB | - | Bar velocity (range/bars) |
| VelC | - | Calendar velocity (range/days) |
| Pr | vs opposite | Price retracement |
| Px | vs same | Price extension |
| Tr | vs opposite | Time retracement |
| Tx | vs same | Time extension |
| Vr | vs opposite | Volume retracement |
| Vx | vs same | Volume extension |
| VelB-r | vs opposite | Bar velocity retracement |
| VelB-x | vs same | Bar velocity extension |
| VelC-r | vs opposite | Calendar velocity retracement |
| VelC-x | vs same | Calendar velocity extension |
These 18 metrics (plus the empty option) give you a complete toolkit for understanding swing structure across four dimensions: price, time, volume, and velocity.