Smooth Charts, Any History Length
Most indicators draw everything from the beginning of time. Load five years of daily data, and they calculate and render thousands of objects — whether you can see them or not.
SSI PRO is built differently. It renders only what you need to see, when you need to see it.
Dynamic Window Drawing
The primary performance optimization: calculate and display only the swings visible in your current chart view.
The Problem It Solves
Without dynamic rendering:
- 1 year of daily data: ~250-500 swing lines
- 5 years of daily data: ~1,250-2,500 swing lines
- 10 years of daily data: ~2,500-5,000 swing lines
Every line consumes memory and processing time. Scroll through a long history and you're dragging thousands of invisible objects behind you.
How Dynamic Window Works
The indicator continuously monitors:
- Your visible chart area (leftmost to rightmost bar)
- A buffer zone beyond the visible edges
- Which swings intersect this window
Only swings within the window (plus buffer) are drawn. As you scroll or zoom, the indicator:
- Removes swings that leave the window
- Adds swings that enter the window
- Pre-loads buffer zone swings for smooth scrolling
 Only swings within the visible window and buffer are rendered.
Performance Impact
| History Length | Dynamic OFF | Dynamic ON | Improvement |
|---|---|---|---|
| 1 year | ~500 lines | ~50-100 lines | 5-10x faster |
| 5 years | ~2,500 lines | ~50-100 lines | 25-50x faster |
| 10 years | ~5,000 lines | ~50-100 lines | 50-100x faster |
With dynamic window enabled, performance stays constant regardless of how much history you load.
The Setting
Setting Name: Use Dynamic Window Drawing
Default: On
Leave this enabled for virtually all use cases.
When to Disable
Consider disabling only if:
- Analyzing very short histories (< 100 bars)
- Need to see all swings simultaneously for a screenshot
- Creating static exports of complete history
Note: Disabling may cause significant lag on longer histories.
Window Buffer
The buffer adds extra bars beyond the visible area, enabling smooth scrolling without constant recalculation.
How Buffer Works
[Buffer Zone] [Visible Chart Area] [Buffer Zone]
     ←50 bars→ ←───────────────────→ ←50 bars→
Swings in the buffer are pre-loaded but not necessarily visible. When you scroll, they're ready to display instantly.
Buffer Size Setting
Setting Name: Window Buffer (Bars)
Default: 50 bars
Range: 10-200 bars
The buffer applies to both sides of the visible area. A 50-bar buffer means 100 extra bars total (50 left + 50 right).
Choosing Buffer Size
| Buffer | Pros | Cons | Best For |
|---|---|---|---|
| Small (10-30) | Minimal memory | Frequent recalculation | Static analysis, limited RAM |
| Medium (40-80) | Smooth scrolling | Minimal | Most users (recommended) |
| Large (100-200) | Very smooth scrolling | Higher memory | Fast scrolling, powerful systems |
Buffer and Timeframes
Buffer effectiveness varies by timeframe:
Lower timeframes (1m-15m): 50 bars covers a brief period. Consider 100+ for smooth scrolling through intraday data.
Higher timeframes (Daily+): 50 bars covers significant time. Default is usually sufficient.
Performance Mode
Additional optimization for resource-constrained situations.
What It Does
Setting Name: Performance Mode
Default: Off
When enabled:
- Reduces visual update frequency
- Batches rendering operations
- Prioritizes calculation over display smoothness
- Maintains full accuracy
What Changes
- Label updates are less frequent
- Line redraws are batched
- Visual transitions are simplified
- Color changes apply in groups
What Doesn't Change
- Swing detection accuracy
- Alert functionality
- Calculation precision
- Final visual output
You get the same results, just with less real-time visual polish.
When to Enable
Enable Performance Mode when:
- Running multiple complex indicators simultaneously
- Analyzing lower timeframes (1m, 5m) with long histories
- Using older hardware
- Experiencing any chart lag
Keep disabled when:
- System performance is good
- Watching swings form in real-time
- Need immediate visual feedback
- Using charts for presentations
Memory Management
Understanding what consumes resources:
Memory Consumers
| Element | Approximate Size |
|---|---|
| Swing line | ~100 bytes |
| Label | ~200 bytes |
| Historical data | Variable |
| Buffer zone | Pre-calculated swings |
Example: 1 year of daily data with ~250 swings:
- 250 lines × 100 bytes = 25KB
- 250 labels × 200 bytes = 50KB
- Total: ~75KB — negligible for modern systems
The issue isn't memory per swing; it's TradingView's rendering overhead with thousands of objects.
Optimization Priority
Ranked by impact:
- Enable Dynamic Window — Biggest impact by far
- Limit visible labels — Moderate impact
- Enable Performance Mode — Moderate impact
- Adjust buffer size — Small impact
Alert & Export Processing
When any alert or export feature is enabled, the indicator scans swing history on every bar to detect new completions. This scan is the single largest processing cost outside of rendering.
What Triggers the Scan
The scan runs when any of these are enabled:
- Swing Completion alerts (High or Low)
- Any Overbalance alert (Pr, Px, Tr, Tx, Vr, Vx)
- Any Velocity alert (Vel-x, Vel-r)
- S/R Proximity alerts
- CSV Export
- JSON Webhook
When all of the above are disabled, the scan is skipped entirely — zero processing cost.
The Dual-Instance Strategy
If you need both real-time visual analysis AND alerts/export, consider running two instances of SSI PRO:
Instance 1 — Visual (fast)
- All alerts OFF, CSV Export OFF, JSON Webhook OFF
- Full swing line rendering for real-time analysis
- No scan overhead — maximum chart responsiveness
Instance 2 — Alerts & Export (background)
- Enable "CSV Export Only" to skip all line and label drawing
- Enable your desired alerts and/or webhook
- Runs the scan loop but skips rendering
- Any processing lag doesn't affect your visual chart
This splits the workload: your visual instance stays snappy for real-time trading, while the background instance handles data processing independently.
When This Matters
The scan overhead is most noticeable on:
- Lower timeframes (1m, 5m) with long histories
- Charts with S/R Proximity enabled and large Max History settings
- Multiple overbalance alerts enabled simultaneously
On daily or weekly charts, the overhead is typically negligible.
Platform Considerations
Performance varies by how you access TradingView:
Desktop App
- Generally fastest
- Best memory management
- Recommended for heavy analysis
Web Browser
- Chrome/Edge typically fastest
- Firefox/Safari may vary
- Clear cache periodically for best results
Mobile App
- Most resource-constrained
- Always use Performance Mode
- Limit visual elements
- Consider higher minimum swing size
Troubleshooting
Slow Chart Updates
Symptoms: Chart takes time to refresh, lag when new bars form
Solutions:
- Verify Dynamic Window is enabled
- Enable Performance Mode
- Increase minimum swing size (fewer swings)
- Reduce number of visible labels
- Check other indicators on the chart
Lag When Scrolling
Symptoms: Stuttering or delay when panning through history
Solutions:
- Increase window buffer size
- Enable Performance Mode
- Verify Dynamic Window is enabled
- Close unnecessary browser tabs or charts
Delayed Real-Time Updates
Symptoms: Swings appear late, labels update slowly
Solutions:
- Reduce number of active alerts
- Simplify label configuration (fewer metrics)
- Increase minimum swing size
- Close unnecessary charts in other tabs
High Memory Usage
Symptoms: Browser/app becomes sluggish over time
Solutions:
- Refresh the page periodically
- Reduce buffer size
- Limit max swing history setting
- Close other charts
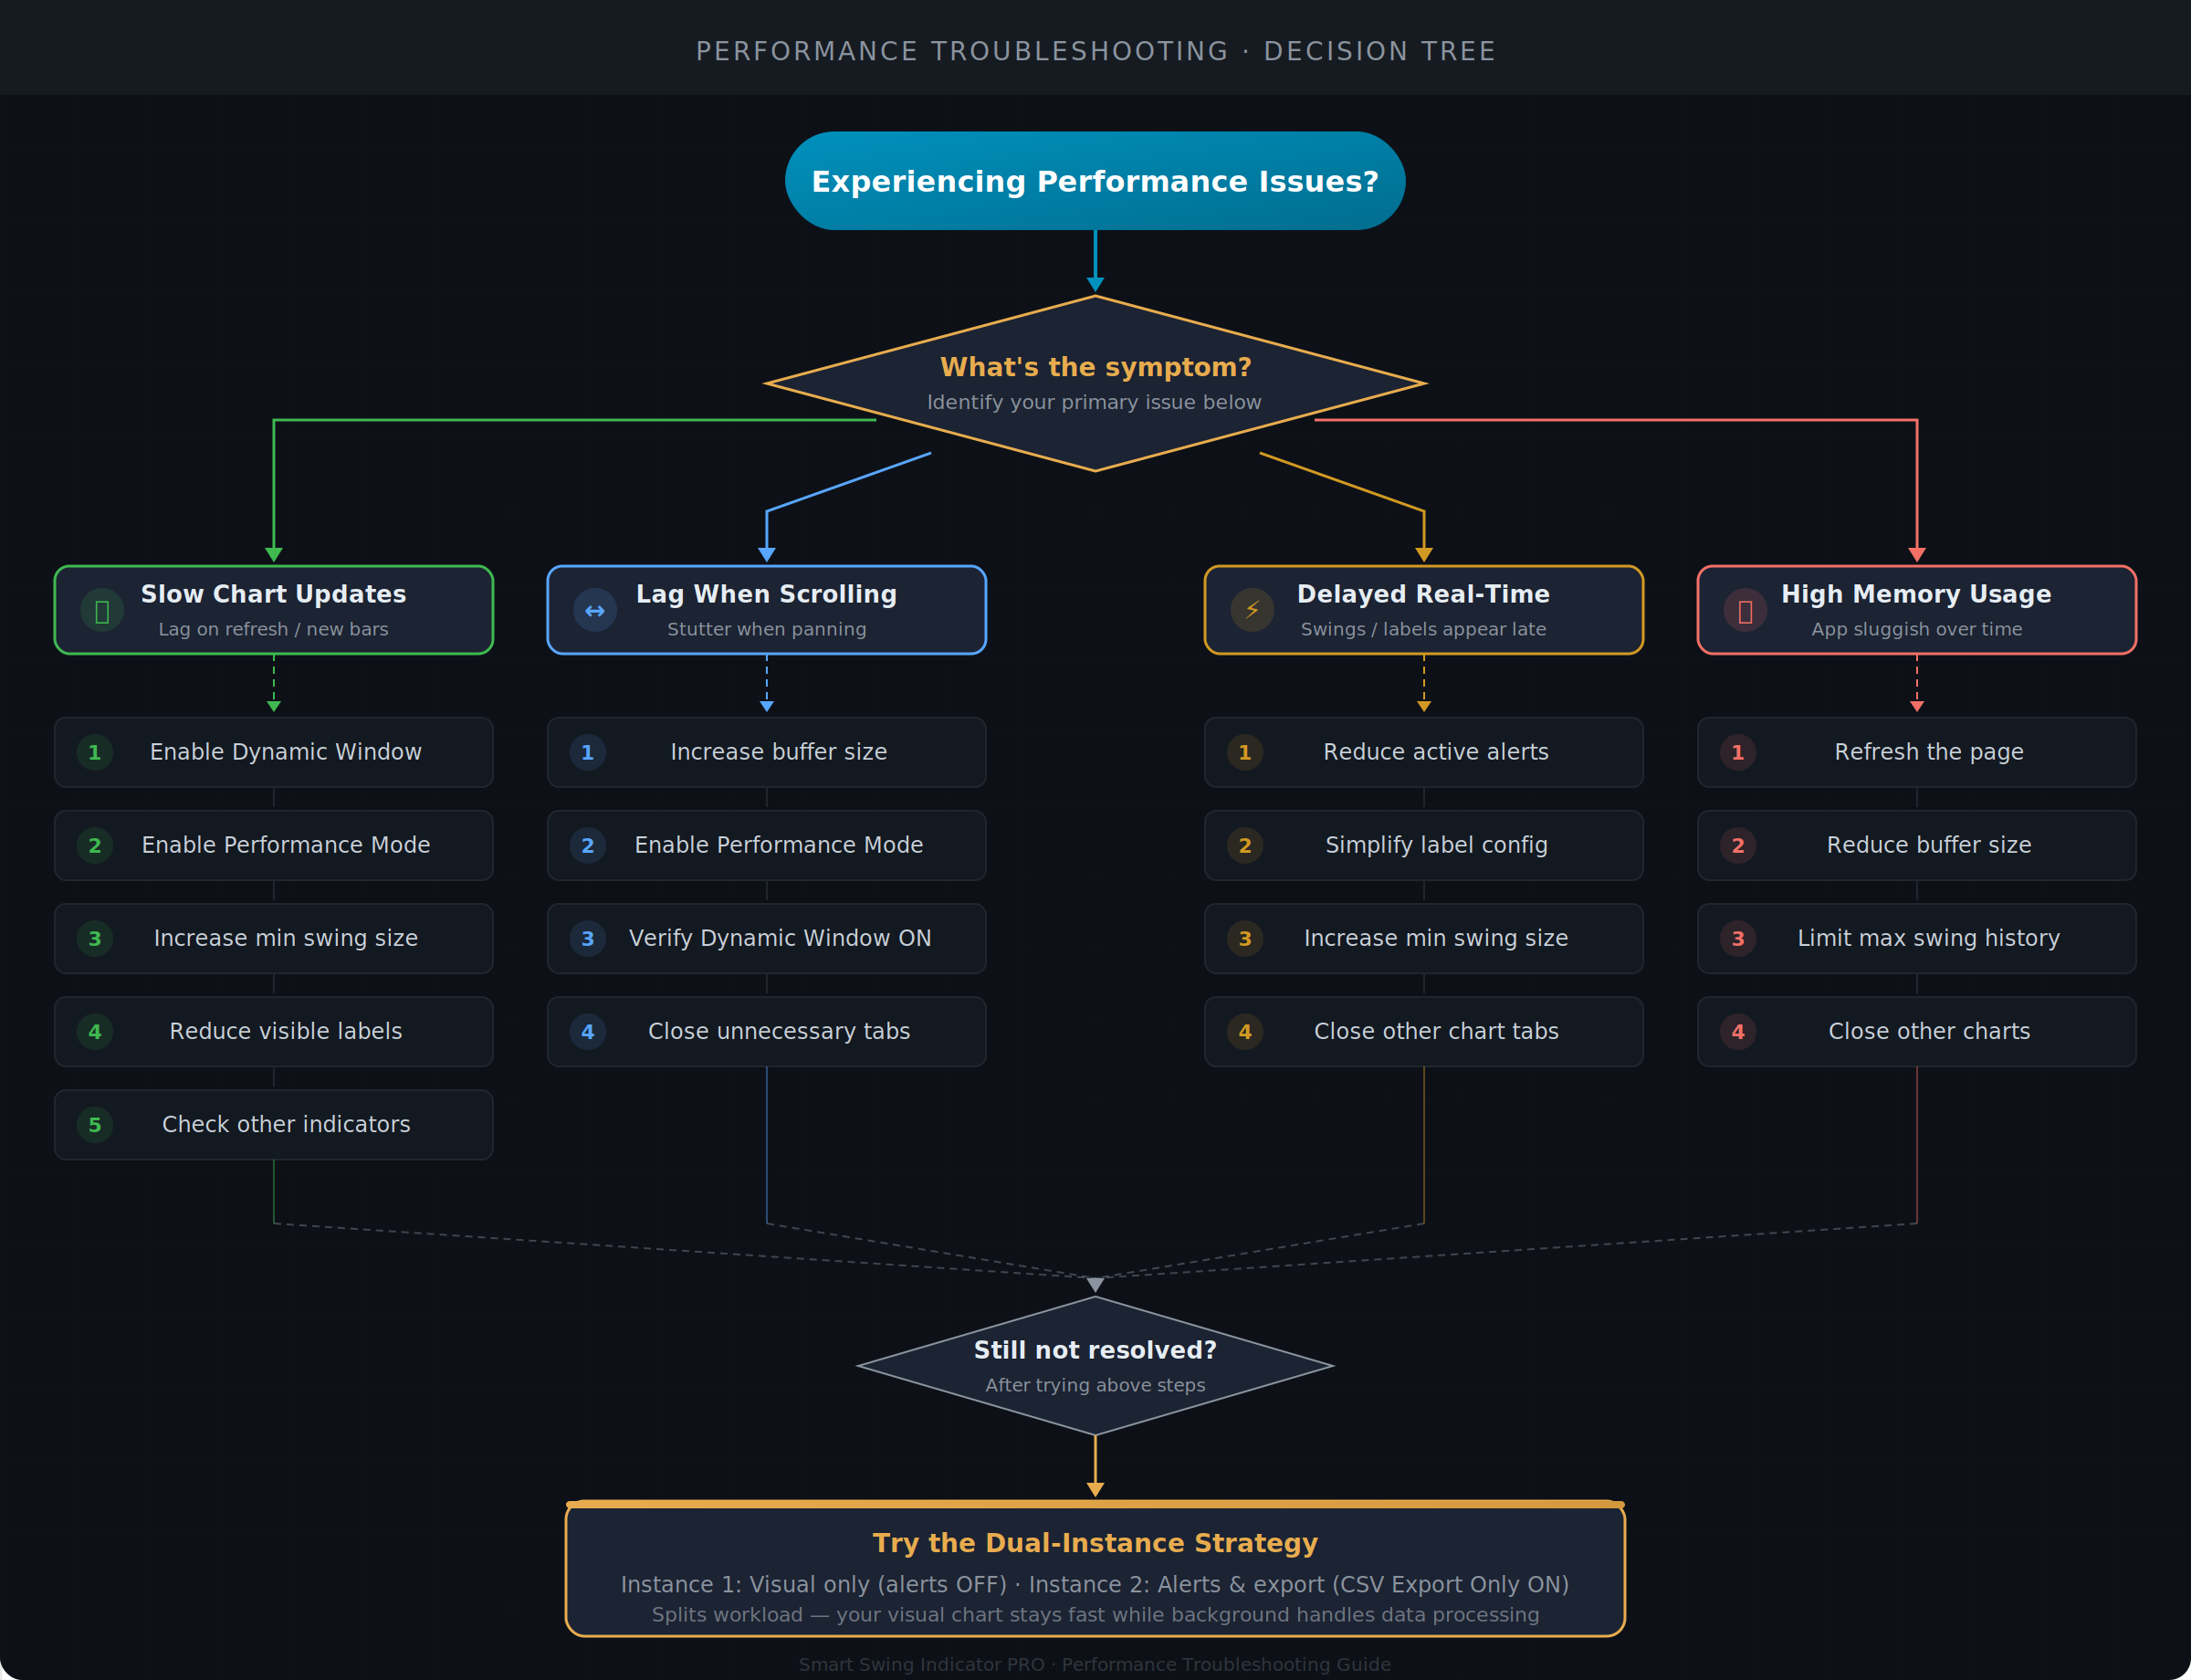 Follow this flowchart to diagnose performance problems.
Best Practices
- Start with defaults — They work well for most users
- Enable optimizations only if needed — Don't fix what isn't broken
- Monitor for lag — Watch for stuttering or delays
- Adjust by timeframe — Lower timeframes need more optimization
- Consider total load — Account for other indicators and charts
- Refresh periodically — Long sessions accumulate overhead
The indicator is highly optimized by default. Most users will never need to adjust these settings — only modify if you experience actual performance issues.
Summary
SSI PRO maintains smooth performance through:
- Dynamic Window: Renders only visible swings (biggest impact)
- Buffer Zone: Pre-loads swings for smooth scrolling
- Performance Mode: Reduces visual overhead when needed
Default settings work for most situations. Enable additional optimizations only if you encounter lag or resource constraints.