The Problem with Price
Most of what happens on a chart is noise. Prices tick up, tick down, wiggle sideways — and somewhere in that chaos, markets actually move. The challenge isn't watching price; it's knowing which price movements matter.
For over a century, professional traders have used swing charts to solve this problem. Instead of reacting to every bar, swing charts reveal the underlying structure: where did price actually turn? How far did it travel? Is this move bigger or smaller than the last?
SSI PRO brings this institutional-grade analysis directly into TradingView — no external software, no manual calculations, no guesswork.
What You're Looking At
When you add SSI PRO to a chart, you'll see diagonal lines connecting swing highs and swing lows. Each line represents a completed price movement from one extreme to another.
Green lines trace upward swings (low to high). Red lines trace downward swings (high to low). At each turning point, a label displays the information you've configured — price, range, percentages, time, volume, or any combination.
The lines aren't drawn randomly. They follow precise mechanical rules that have been refined over decades of trading application. Every high and low you see passed the same objective test. No curve-fitting. No hindsight adjustments.
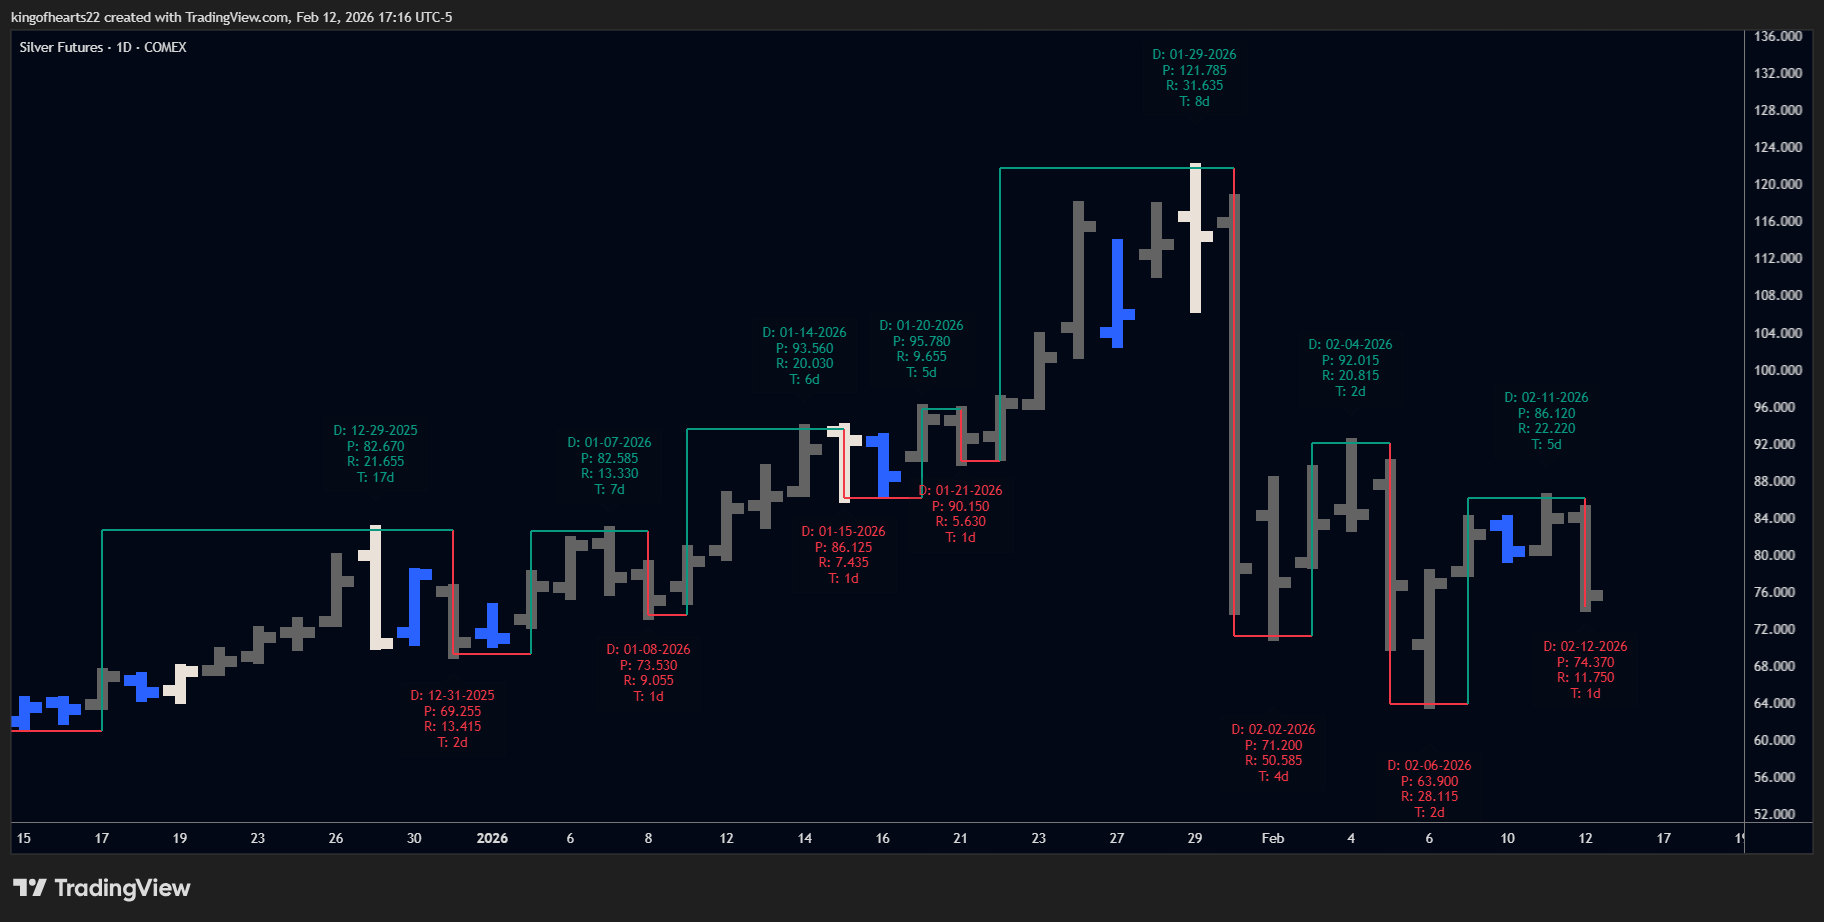 SSI PRO on a daily chart
The AND Logic Difference
Here's where SSI PRO separates itself from typical swing indicators.
Most tools use "OR" logic to identify direction: if price makes a higher high or a higher low, they call it an up bar. This sounds reasonable until you realize it creates false signals constantly. A bar can make a higher high while simultaneously making a lower low — what direction is that?
SSI PRO uses true AND logic: a bar only counts as directional when both conditions are met. Higher high AND higher low for up. Lower high AND lower low for down. This single distinction eliminates the ambiguity that plagues simpler approaches.
When you look at an SSI PRO swing, you know both extremes of that bar confirmed the direction. There's no hidden "maybe" built into the reading.
Inside Bars: The Invisible Pause
An inside bar is contained entirely within the previous bar's range — its high is lower (or equal), its low is higher (or equal). The market hasn't decided anything yet.
SSI PRO treats inside bars as invisible to swing logic. They don't count as up. They don't count as down. They're a pause, not a decision.
This matters more than it might seem. Other tools often misread inside bars as reversals or continuations, cluttering your chart with false turning points. SSI PRO waits. When price finally breaks out and makes a directional move, that's when the swing updates.
You can optionally highlight inside bars with a distinct color to track where these pauses occur, but they never influence the swing structure itself.
 Inside bars are invisible to swing logic. The indicator waits for a decisive move.
Outside Bars: Intelligent Resolution
An outside bar engulfs the previous bar's range — higher high AND lower low. It moved in both directions. Now what?
This is where many swing tools fail completely. They either ignore outside bars, always treat them as reversals, or always treat them as continuations. None of these rigid approaches match how markets actually behave.
SSI PRO implements "wait and see" logic. When an outside bar appears, the indicator captures both extremes and waits for the next bar to reveal which direction won. The outside bar gets classified retroactively based on what actually happened next.
You control how this resolution appears on your chart:
- Mark as Continuation: Places the swing point at the bar before the outside bar (the classic conservative approach)
- Mark as Reversal: Places the swing point at the outside bar's extreme when structurally safe
- Skip Entirely: Omits the intermediate swing and continues in the prevailing direction
The system automatically detects situations where "Mark as Reversal" would create chart anomalies and falls back to safe behavior. On higher timeframes (Weekly+), it also validates the chronological order of extremes within each bar to ensure time-based metrics remain accurate. You get flexibility without broken output.
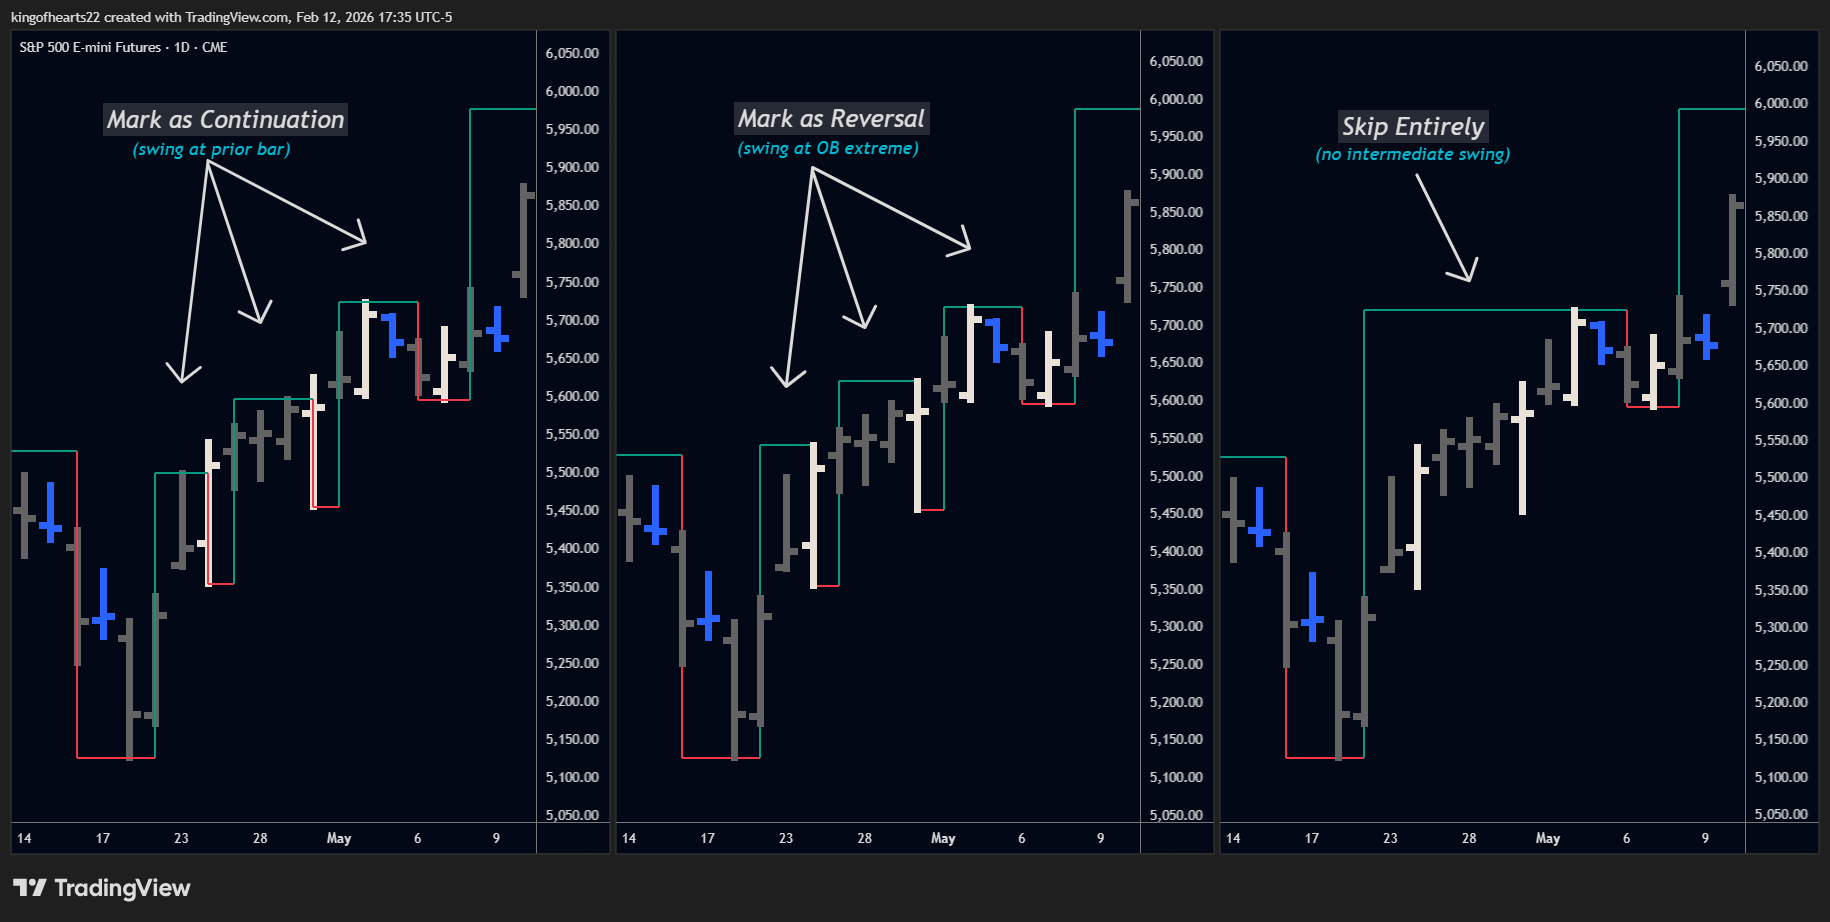 Three ways to handle outside bars. Choose based on how much detail you want visible.
Multi-Day Swings: Filtering the Noise
W.D. Gann wrote in 1950: "One day is too short a period of time."
A single bar — whether daily, hourly, or weekly — captures a snapshot. But snapshots lie. A market can print one down bar in the middle of a roaring uptrend. Does that make it a reversal? Almost never.
SSI PRO's Swing Period setting lets you require multiple consecutive bars before confirming a swing. At Swing Period 2, a swing only reverses after two consecutive bars in the new direction. At Swing Period 3, you need three.
Higher swing periods filter out single-bar fakeouts and reveal the larger structure underneath. Lower timeframe traders often run multiple instances — a 1-period swing for precision, a 2-period or 3-period swing for context — to see the "wheels within wheels" that drive markets.
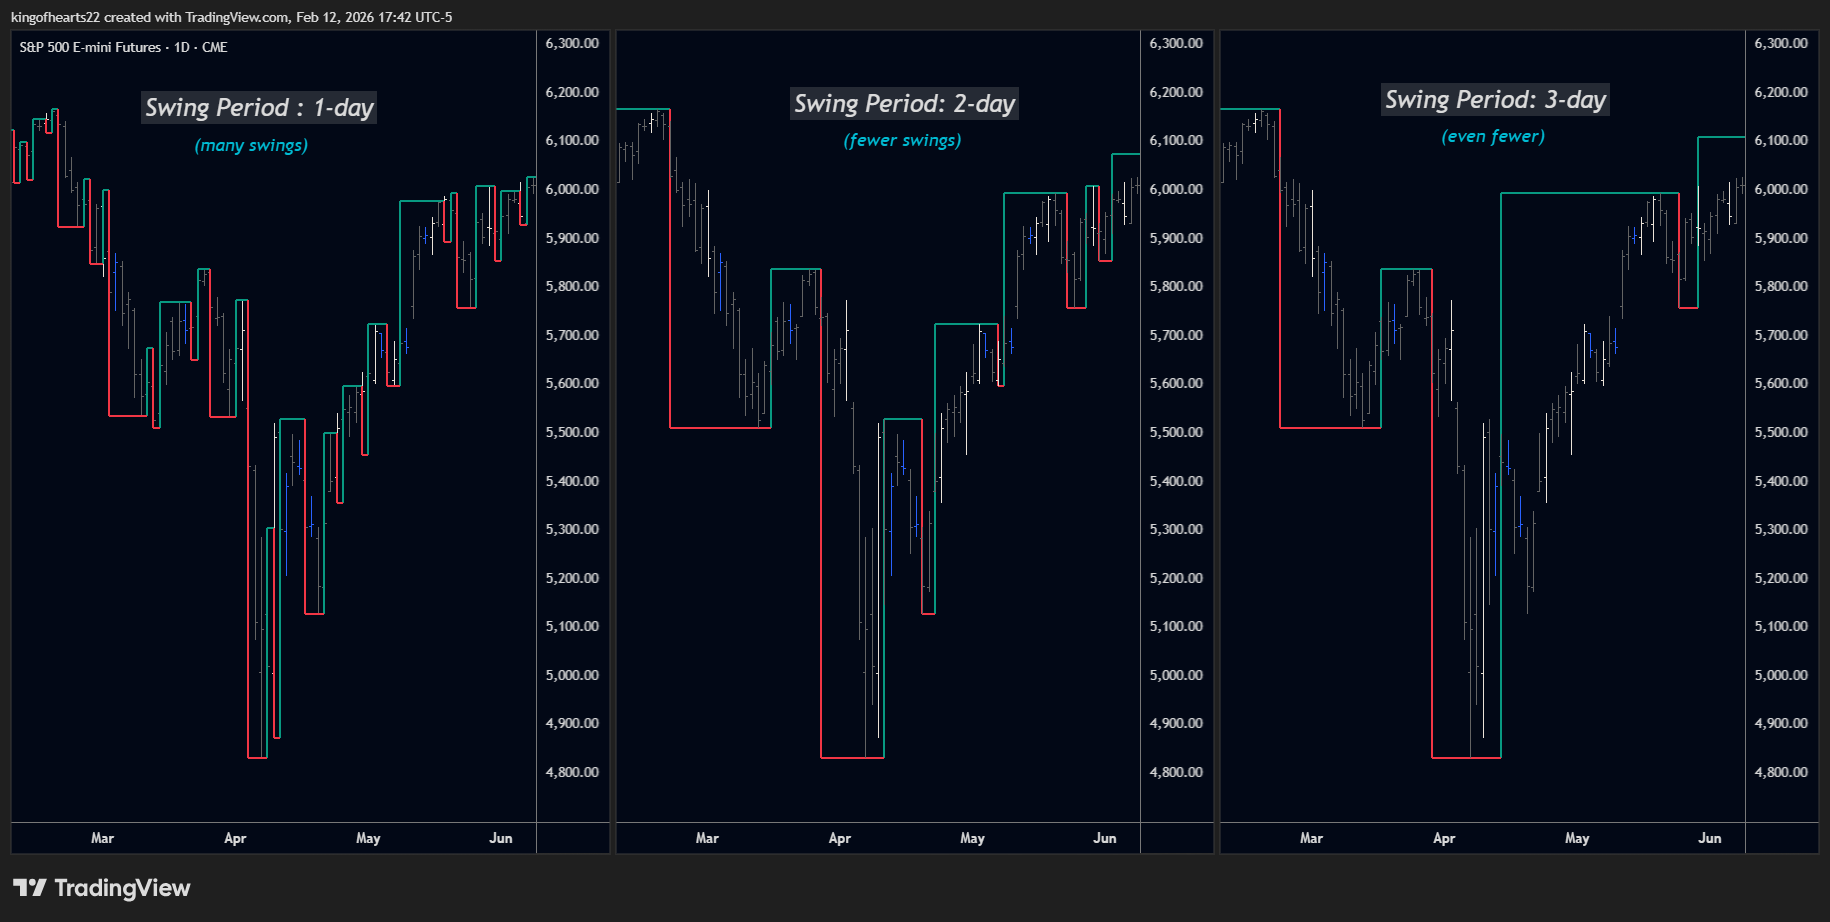 Swing Period 1 vs 2 vs 3. Higher periods filter noise and reveal larger structure.
Gann's Exception Rule
Sometimes price exceeds a prior swing extreme without running the required consecutive bars to technically confirm. Strict mechanical rules would miss that entire section of movement.
Gann's Exception Rule (optional in v1.9+) catches these situations. When price breaks a previous high or low, the swing extends to capture that range even if the consecutive bar count wasn't fully met.
This preserves accurate range measurement while maintaining the noise-filtering benefits of multi-day analysis. It's a nuance from the original methodology that most software ignores entirely.
What SSI PRO Doesn't Do
SSI PRO shows you structure. It doesn't tell you what to do with it.
The indicator displays objective swing points, ranges, and ratios. It does not generate buy signals. It does not predict where price will go. It does not tell you when to enter or exit.
How you use swing structure — for trend identification, for stop placement, for target calculation, for pattern recognition — is your decision. SSI PRO provides the foundation; you build on it.
Summary
SSI PRO is a complete mechanical swing charting system:
- True AND logic for directional clarity
- Invisible inside bars that don't pollute your swings
- Intelligent outside bar resolution with multiple modes
- Multi-day swing periods for noise filtering
- Gann's Exception Rule for accurate range capture
- 17 metrics measuring price, time, volume, and velocity relationships
- Professional display options for clean presentation
It implements century-old institutional methodology with modern pattern recognition — available directly in TradingView at a fraction of what traditional software costs.
The following pages cover Settings (every configurable option) and Metrics (understanding the 16 label values).